Stock Analysis

Key Insights
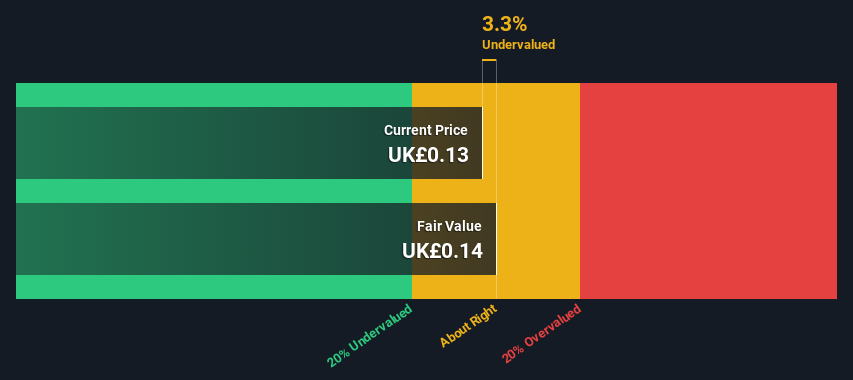
- The projected fair value for Coral Products is UK£0.14 based on 2 Stage Free Cash Flow to Equity
- Coral Products' UK£0.13 share price indicates it is trading at similar levels as its fair value estimate
- When compared to theindustry average discount to fair value of 34%, Coral Products' competitors seem to be trading at a greater discount
Today we will run through one way of estimating the intrinsic value of Coral Products PLC (LON:CRU) by taking the expected future cash flows and discounting them to today's value. We will use the Discounted Cash Flow (DCF) model on this occasion. Before you think you won't be able to understand it, just read on! It's actually much less complex than you'd imagine.
Companies can be valued in a lot of ways, so we would point out that a DCF is not perfect for every situation. Anyone interested in learning a bit more about intrinsic value should have a read of the Simply Wall St analysis model.
See our latest analysis for Coral Products
What's The Estimated Valuation?
We use what is known as a 2-stage model, which simply means we have two different periods of growth rates for the company's cash flows. Generally the first stage is higher growth, and the second stage is a lower growth phase. To start off with, we need to estimate the next ten years of cash flows. Where possible we use analyst estimates, but when these aren't available we extrapolate the previous free cash flow (FCF) from the last estimate or reported value. We assume companies with shrinking free cash flow will slow their rate of shrinkage, and that companies with growing free cash flow will see their growth rate slow, over this period. We do this to reflect that growth tends to slow more in the early years than it does in later years.
Generally we assume that a dollar today is more valuable than a dollar in the future, and so the sum of these future cash flows is then discounted to today's value:
10-year free cash flow (FCF) estimate
| 2024 | 2025 | 2026 | 2027 | 2028 | 2029 | 2030 | 2031 | 2032 | 2033 | |
| Levered FCF (£, Millions) | -UK£600.0k | UK£900.0k | UK£897.4k | UK£900.4k | UK£907.2k | UK£916.9k | UK£928.6k | UK£941.8k | UK£956.2k | UK£971.5k |
| Growth Rate Estimate Source | Analyst x1 | Analyst x1 | Est @ -0.29% | Est @ 0.33% | Est @ 0.76% | Est @ 1.06% | Est @ 1.28% | Est @ 1.42% | Est @ 1.53% | Est @ 1.60% |
| Present Value (£, Millions) Discounted @ 8.0% | -UK£0.6 | UK£0.8 | UK£0.7 | UK£0.7 | UK£0.6 | UK£0.6 | UK£0.5 | UK£0.5 | UK£0.5 | UK£0.5 |
("Est" = FCF growth rate estimated by Simply Wall St)
Present Value of 10-year Cash Flow (PVCF) = UK£4.8m
After calculating the present value of future cash flows in the initial 10-year period, we need to calculate the Terminal Value, which accounts for all future cash flows beyond the first stage. For a number of reasons a very conservative growth rate is used that cannot exceed that of a country's GDP growth. In this case we have used the 5-year average of the 10-year government bond yield (1.8%) to estimate future growth. In the same way as with the 10-year 'growth' period, we discount future cash flows to today's value, using a cost of equity of 8.0%.
Terminal Value (TV)= FCF2033 × (1 + g) ÷ (r – g) = UK£972k× (1 + 1.8%) ÷ (8.0%– 1.8%) = UK£16m
Present Value of Terminal Value (PVTV)= TV / (1 + r)10= UK£16m÷ ( 1 + 8.0%)10= UK£7.4m
The total value, or equity value, is then the sum of the present value of the future cash flows, which in this case is UK£12m. To get the intrinsic value per share, we divide this by the total number of shares outstanding. Relative to the current share price of UK£0.1, the company appears about fair value at a 3.3% discount to where the stock price trades currently. The assumptions in any calculation have a big impact on the valuation, so it is better to view this as a rough estimate, not precise down to the last cent.
The Assumptions
Now the most important inputs to a discounted cash flow are the discount rate, and of course, the actual cash flows. You don't have to agree with these inputs, I recommend redoing the calculations yourself and playing with them. The DCF also does not consider the possible cyclicality of an industry, or a company's future capital requirements, so it does not give a full picture of a company's potential performance. Given that we are looking at Coral Products as potential shareholders, the cost of equity is used as the discount rate, rather than the cost of capital (or weighted average cost of capital, WACC) which accounts for debt. In this calculation we've used 8.0%, which is based on a levered beta of 1.130. Beta is a measure of a stock's volatility, compared to the market as a whole. We get our beta from the industry average beta of globally comparable companies, with an imposed limit between 0.8 and 2.0, which is a reasonable range for a stable business.
SWOT Analysis for Coral Products
- Debt is well covered by earnings and cashflows.
- Earnings declined over the past year.
- Current share price is below our estimate of fair value.
- No apparent threats visible for CRU.
Next Steps:
Although the valuation of a company is important, it ideally won't be the sole piece of analysis you scrutinize for a company. It's not possible to obtain a foolproof valuation with a DCF model. Instead the best use for a DCF model is to test certain assumptions and theories to see if they would lead to the company being undervalued or overvalued. For example, changes in the company's cost of equity or the risk free rate can significantly impact the valuation. For Coral Products, we've put together three relevant items you should assess:
- Risks: Take risks, for example - Coral Products has 5 warning signs (and 1 which is a bit unpleasant) we think you should know about.
- Management:Have insiders been ramping up their shares to take advantage of the market's sentiment for CRU's future outlook? Check out our management and board analysis with insights on CEO compensation and governance factors.
- Other Solid Businesses: Low debt, high returns on equity and good past performance are fundamental to a strong business. Why not explore our interactive list of stocks with solid business fundamentals to see if there are other companies you may not have considered!
PS. The Simply Wall St app conducts a discounted cash flow valuation for every stock on the AIM every day. If you want to find the calculation for other stocks just search here.
Valuation is complex, but we're helping make it simple.
Find out whether Coral Products is potentially over or undervalued by checking out our comprehensive analysis, which includes fair value estimates, risks and warnings, dividends, insider transactions and financial health.
View the Free AnalysisHave feedback on this article? Concerned about the content? Get in touch with us directly. Alternatively, email editorial-team (at) simplywallst.com.
This article by Simply Wall St is general in nature. We provide commentary based on historical data and analyst forecasts only using an unbiased methodology and our articles are not intended to be financial advice. It does not constitute a recommendation to buy or sell any stock, and does not take account of your objectives, or your financial situation. We aim to bring you long-term focused analysis driven by fundamental data. Note that our analysis may not factor in the latest price-sensitive company announcements or qualitative material. Simply Wall St has no position in any stocks mentioned.
Valuation is complex, but we're helping make it simple.
Find out whether Coral Products is potentially over or undervalued by checking out our comprehensive analysis, which includes fair value estimates, risks and warnings, dividends, insider transactions and financial health.
View the Free AnalysisHave feedback on this article? Concerned about the content? Get in touch with us directly. Alternatively, email editorial-team@simplywallst.com
About AIM:CRU
Coral Products
Manufactures and sells plastic injection and mouldings, extruded and vacuum formed, fabricated products, and cap enclosures in the United Kingdom, rest of Europe, and internationally.
Adequate balance sheet and slightly overvalued.
