
Advertisement

Looking at RSA Insurance Group plc’s (LON:RSA) fundamentals some investors are wondering if its last closing price of £5.228 represents a good value for money for this high growth stock. Let’s take a look at some key metrics to determine whether there's any value here for current and potential future investors.
View our latest analysis for RSA Insurance Group
Has the RSA train has slowed down?
The excitement around RSA Insurance Group's growth potential is not unfounded. Expectations from 10 analysts are extremely bullish with earnings per share estimated to surge from current levels of £0.318 to £0.534 over the next three years. On average, this leads to a growth rate of 18% each year, which indicates an exceedlingly positive future in the near term.
Can RSA's share price be justified by its earnings growth?
RSA Insurance Group is trading at quite low price-to-earnings (PE) ratio of 16.44x. This tells us the stock is overvalued compared to the GB market average ratio of 16.11x , and overvalued based on current earnings compared to the Insurance industry average of 16.05x .
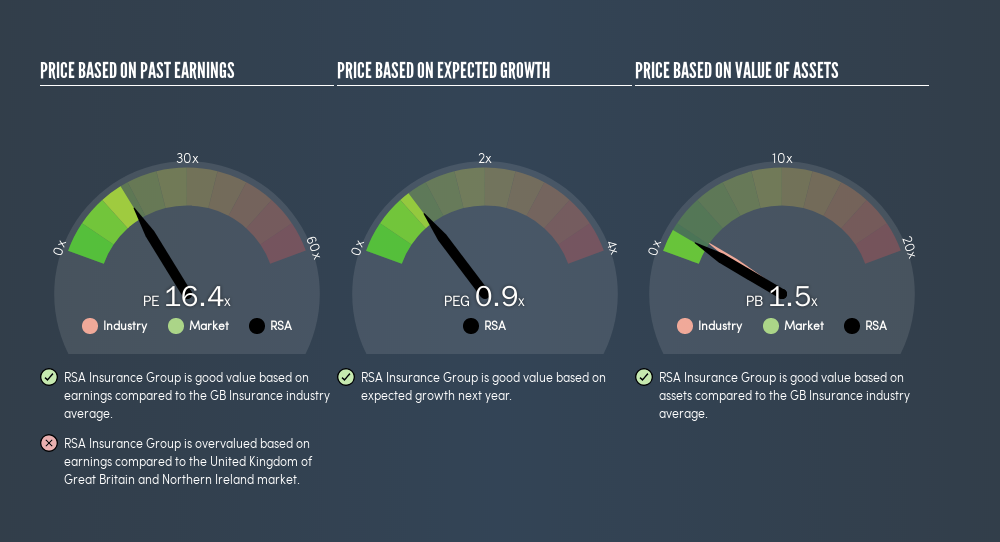
We already know that RSA appears to be overvalued when compared to its industry average. But, to be able to properly assess the value of a high-growth stock such as RSA Insurance Group, we must incorporate its earnings growth in our valuation. The PEG ratio is a great calculation to take account of growth in the stock's valuation. A PE ratio of 16.44x and expected year-on-year earnings growth of 18% give RSA Insurance Group a low PEG ratio of 0.94x. So, when we include the growth factor in our analysis, RSA Insurance Group appears fairly valued , based on the fundamentals.
What this means for you:
RSA's current undervaluation could signal a potential buying opportunity to increase your exposure to the stock, or it you're a potential investor, now may be the right time to buy. However, basing your investment decision off one metric alone is certainly not sufficient. There are many things I have not taken into account in this article and the PEG ratio is very one-dimensional. If you have not done so already, I urge you to complete your research by taking a look at the following:
- Financial Health: Are RSA’s operations financially sustainable? Balance sheets can be hard to analyze, which is why we’ve done it for you. Check out our financial health checks here.
- Past Track Record: Has RSA been consistently performing well irrespective of the ups and downs in the market? Go into more detail in the past performance analysis and take a look at the free visual representations of RSA's historicals for more clarity.
- Other High-Performing Stocks: Are there other stocks that provide better prospects with proven track records? Explore our free list of these great stocks here.
We aim to bring you long-term focused research analysis driven by fundamental data. Note that our analysis may not factor in the latest price-sensitive company announcements or qualitative material.
If you spot an error that warrants correction, please contact the editor at editorial-team@simplywallst.com. This article by Simply Wall St is general in nature. It does not constitute a recommendation to buy or sell any stock, and does not take account of your objectives, or your financial situation. Simply Wall St has no position in the stocks mentioned. Thank you for reading.
Market Insights

Advertisement
Community Narratives
Vita Life Sciences Set for a 12.72% Revenue Growth While Tackling Operational Challenges
Fair Value AU$2.42|9.5% undervalued
RO
Community Contributor
Vossloh rides a €500 billion wave to boost growth and earnings in the next decade
Fair Value €78.41|7.2% undervalued
CH
Community Contributor
Intuitive Surgical Will Transform Healthcare with 12% Revenue Growth
Fair Value US$325.55|56.5% overvalued
UN
Community Contributor