
Advertisement
- United Kingdom
- /
- Healthtech
- /
- AIM:EMIS
EMIS Group plc's (LON:EMIS) Stock Has Been Sliding But Fundamentals Look Strong: Is The Market Wrong?
It is hard to get excited after looking at EMIS Group's (LON:EMIS) recent performance, when its stock has declined 4.4% over the past three months. However, a closer look at its sound financials might cause you to think again. Given that fundamentals usually drive long-term market outcomes, the company is worth looking at. In this article, we decided to focus on EMIS Group's ROE.
Return on equity or ROE is a key measure used to assess how efficiently a company's management is utilizing the company's capital. In simpler terms, it measures the profitability of a company in relation to shareholder's equity.
See our latest analysis for EMIS Group
How Do You Calculate Return On Equity?
The formula for return on equity is:
Return on Equity = Net Profit (from continuing operations) ÷ Shareholders' Equity
So, based on the above formula, the ROE for EMIS Group is:
24% = UK£27m ÷ UK£109m (Based on the trailing twelve months to June 2020).
The 'return' is the profit over the last twelve months. So, this means that for every £1 of its shareholder's investments, the company generates a profit of £0.24.
Why Is ROE Important For Earnings Growth?
Thus far, we have learned that ROE measures how efficiently a company is generating its profits. We now need to evaluate how much profit the company reinvests or "retains" for future growth which then gives us an idea about the growth potential of the company. Generally speaking, other things being equal, firms with a high return on equity and profit retention, have a higher growth rate than firms that don’t share these attributes.
A Side By Side comparison of EMIS Group's Earnings Growth And 24% ROE
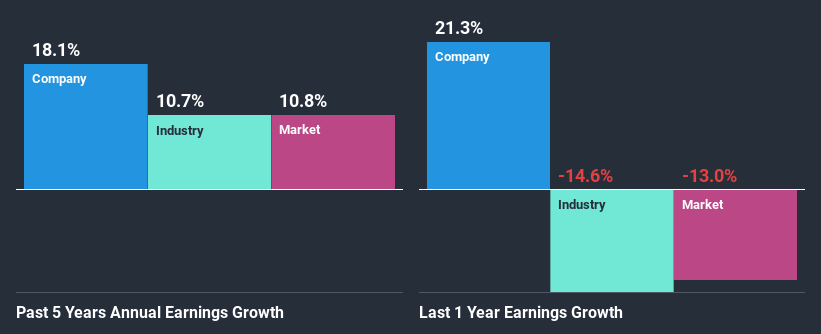
To begin with, EMIS Group has a pretty high ROE which is interesting. Secondly, even when compared to the industry average of 12% the company's ROE is quite impressive. Probably as a result of this, EMIS Group was able to see a decent net income growth of 18% over the last five years.
As a next step, we compared EMIS Group's net income growth with the industry, and pleasingly, we found that the growth seen by the company is higher than the average industry growth of 13%.
The basis for attaching value to a company is, to a great extent, tied to its earnings growth. What investors need to determine next is if the expected earnings growth, or the lack of it, is already built into the share price. This then helps them determine if the stock is placed for a bright or bleak future. Is EMIS fairly valued? This infographic on the company's intrinsic value has everything you need to know.
Is EMIS Group Making Efficient Use Of Its Profits?
While EMIS Group has a three-year median payout ratio of 87% (which means it retains 13% of profits), the company has still seen a fair bit of earnings growth in the past, meaning that its high payout ratio hasn't hampered its ability to grow.
Additionally, EMIS Group has paid dividends over a period of at least ten years which means that the company is pretty serious about sharing its profits with shareholders. Upon studying the latest analysts' consensus data, we found that the company's future payout ratio is expected to drop to 66% over the next three years.
Summary
In total, we are pretty happy with EMIS Group's performance. We are particularly impressed by the considerable earnings growth posted by the company, which was likely backed by its high ROE. While the company is paying out most of its earnings as dividends, it has been able to grow its earnings in spite of it, so that's probably a good sign. That being so, a study of the latest analyst forecasts show that the company is expected to see a slowdown in its future earnings growth. To know more about the latest analysts predictions for the company, check out this visualization of analyst forecasts for the company.
When trading EMIS Group or any other investment, use the platform considered by many to be the Professional's Gateway to the Worlds Market, Interactive Brokers. You get the lowest-cost* trading on stocks, options, futures, forex, bonds and funds worldwide from a single integrated account. Promoted
Valuation is complex, but we're here to simplify it.
Discover if EMIS Group might be undervalued or overvalued with our detailed analysis, featuring fair value estimates, potential risks, dividends, insider trades, and its financial condition.
Access Free AnalysisThis article by Simply Wall St is general in nature. It does not constitute a recommendation to buy or sell any stock, and does not take account of your objectives, or your financial situation. We aim to bring you long-term focused analysis driven by fundamental data. Note that our analysis may not factor in the latest price-sensitive company announcements or qualitative material. Simply Wall St has no position in any stocks mentioned.
*Interactive Brokers Rated Lowest Cost Broker by StockBrokers.com Annual Online Review 2020
Have feedback on this article? Concerned about the content? Get in touch with us directly. Alternatively, email editorial-team@simplywallst.com.
About AIM:EMIS
EMIS Group
EMIS Group plc, through its subsidiaries, provides connected healthcare software and systems for healthcare professionals in the United Kingdom.
Flawless balance sheet with proven track record.
Similar Companies
Market Insights

Advertisement
Community Narratives
The company that turned a verb into a global necessity and basically runs the modern internet, digital ads, smartphones, maps, and AI.
Fair Value US$300.00|5.2% undervalued
OS
Community Contributor
Flowers Foods Pays A Fair Price For Health
Fair Value US$16.12|24.9% undervalued
NV
Community Contributor
TMX Group will thrive with 33.3% profit margin and enduring market moat
Fair Value CA$49.90|3.3% overvalued
LI
Community Contributor
The "Molecular Pencil": Why Beam's Technology is Built to Win
Fair Value US$65.01|64.5% undervalued
DA
Community Contributor