Stock Analysis
- United Kingdom
- /
- Oil and Gas
- /
- LSE:DEC
Diversified Energy (LON:DEC shareholders incur further losses as stock declines 7.0% this week, taking one-year losses to 39%


It's easy to match the overall market return by buying an index fund. While individual stocks can be big winners, plenty more fail to generate satisfactory returns. Unfortunately the Diversified Energy Company PLC (LON:DEC) share price slid 47% over twelve months. That falls noticeably short of the market return of around 2.8%. We note that it has not been easy for shareholders over three years, either; the share price is down 35% in that time. Shareholders have had an even rougher run lately, with the share price down 27% in the last 90 days.
If the past week is anything to go by, investor sentiment for Diversified Energy isn't positive, so let's see if there's a mismatch between fundamentals and the share price.
See our latest analysis for Diversified Energy
To paraphrase Benjamin Graham: Over the short term the market is a voting machine, but over the long term it's a weighing machine. One flawed but reasonable way to assess how sentiment around a company has changed is to compare the earnings per share (EPS) with the share price.
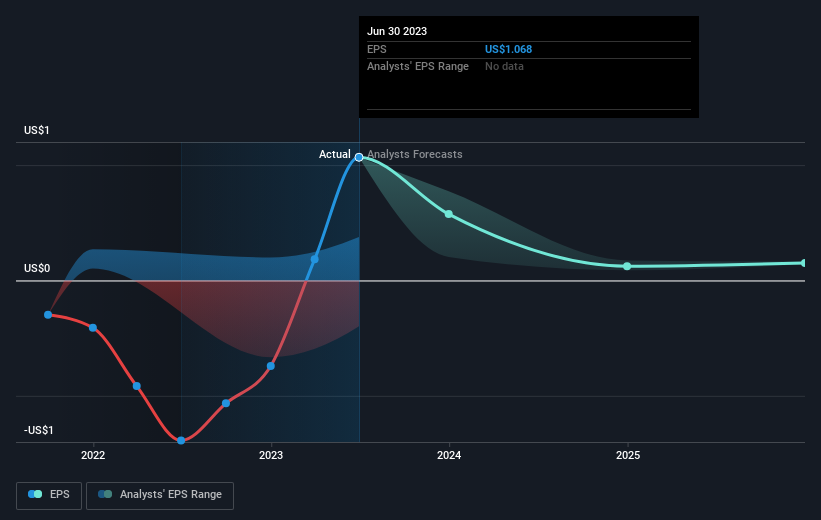
During the last year Diversified Energy grew its earnings per share, moving from a loss to a profit.
The result looks like a strong improvement to us, so we're surprised the market has sold down the shares. If the company can sustain the earnings growth, this might be an inflection point for the business, which would make right now a really interesting time to study it more closely.
You can see below how EPS has changed over time (discover the exact values by clicking on the image).
We like that insiders have been buying shares in the last twelve months. Having said that, most people consider earnings and revenue growth trends to be a more meaningful guide to the business. Before buying or selling a stock, we always recommend a close examination of historic growth trends, available here..
What About Dividends?
When looking at investment returns, it is important to consider the difference between total shareholder return (TSR) and share price return. Whereas the share price return only reflects the change in the share price, the TSR includes the value of dividends (assuming they were reinvested) and the benefit of any discounted capital raising or spin-off. Arguably, the TSR gives a more comprehensive picture of the return generated by a stock. As it happens, Diversified Energy's TSR for the last 1 year was -39%, which exceeds the share price return mentioned earlier. And there's no prize for guessing that the dividend payments largely explain the divergence!
A Different Perspective
Investors in Diversified Energy had a tough year, with a total loss of 39% (including dividends), against a market gain of about 2.8%. However, keep in mind that even the best stocks will sometimes underperform the market over a twelve month period. On the bright side, long term shareholders have made money, with a gain of 0.5% per year over half a decade. It could be that the recent sell-off is an opportunity, so it may be worth checking the fundamental data for signs of a long term growth trend. I find it very interesting to look at share price over the long term as a proxy for business performance. But to truly gain insight, we need to consider other information, too. Take risks, for example - Diversified Energy has 5 warning signs (and 2 which are significant) we think you should know about.
If you like to buy stocks alongside management, then you might just love this free list of companies. (Hint: insiders have been buying them).
Please note, the market returns quoted in this article reflect the market weighted average returns of stocks that currently trade on British exchanges.
Valuation is complex, but we're helping make it simple.
Find out whether Diversified Energy is potentially over or undervalued by checking out our comprehensive analysis, which includes fair value estimates, risks and warnings, dividends, insider transactions and financial health.
View the Free AnalysisHave feedback on this article? Concerned about the content? Get in touch with us directly. Alternatively, email editorial-team (at) simplywallst.com.
This article by Simply Wall St is general in nature. We provide commentary based on historical data and analyst forecasts only using an unbiased methodology and our articles are not intended to be financial advice. It does not constitute a recommendation to buy or sell any stock, and does not take account of your objectives, or your financial situation. We aim to bring you long-term focused analysis driven by fundamental data. Note that our analysis may not factor in the latest price-sensitive company announcements or qualitative material. Simply Wall St has no position in any stocks mentioned.
About LSE:DEC
Diversified Energy
Operates as an independent owner and operator of producing natural gas and oil wells primarily in the Appalachian Basin of the United States.
Undervalued average dividend payer.
