
Advertisement
- United Kingdom
- /
- Oil and Gas
- /
- AIM:TRIN
Trinity Exploration & Production (LON:TRIN) Has A Somewhat Strained Balance Sheet
Some say volatility, rather than debt, is the best way to think about risk as an investor, but Warren Buffett famously said that 'Volatility is far from synonymous with risk.' When we think about how risky a company is, we always like to look at its use of debt, since debt overload can lead to ruin. As with many other companies Trinity Exploration & Production plc (LON:TRIN) makes use of debt. But the real question is whether this debt is making the company risky.
Why Does Debt Bring Risk?
Debt is a tool to help businesses grow, but if a business is incapable of paying off its lenders, then it exists at their mercy. In the worst case scenario, a company can go bankrupt if it cannot pay its creditors. However, a more common (but still painful) scenario is that it has to raise new equity capital at a low price, thus permanently diluting shareholders. Having said that, the most common situation is where a company manages its debt reasonably well - and to its own advantage. The first thing to do when considering how much debt a business uses is to look at its cash and debt together.
Check out our latest analysis for Trinity Exploration & Production
What Is Trinity Exploration & Production's Net Debt?
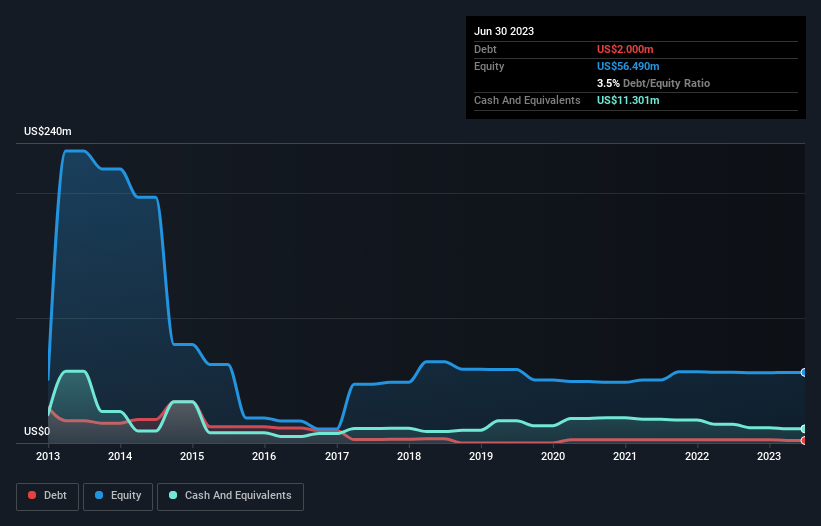
The image below, which you can click on for greater detail, shows that Trinity Exploration & Production had debt of US$2.00m at the end of June 2023, a reduction from US$2.70m over a year. But on the other hand it also has US$11.3m in cash, leading to a US$9.30m net cash position.
How Healthy Is Trinity Exploration & Production's Balance Sheet?
The latest balance sheet data shows that Trinity Exploration & Production had liabilities of US$15.4m due within a year, and liabilities of US$55.6m falling due after that. Offsetting these obligations, it had cash of US$11.3m as well as receivables valued at US$8.91m due within 12 months. So its liabilities outweigh the sum of its cash and (near-term) receivables by US$50.8m.
When you consider that this deficiency exceeds the company's US$36.2m market capitalization, you might well be inclined to review the balance sheet intently. Hypothetically, extremely heavy dilution would be required if the company were forced to pay down its liabilities by raising capital at the current share price. Given that Trinity Exploration & Production has more cash than debt, we're pretty confident it can handle its debt, despite the fact that it has a lot of liabilities in total.
In addition to that, we're happy to report that Trinity Exploration & Production has boosted its EBIT by 35%, thus reducing the spectre of future debt repayments. The balance sheet is clearly the area to focus on when you are analysing debt. But it is Trinity Exploration & Production's earnings that will influence how the balance sheet holds up in the future. So if you're keen to discover more about its earnings, it might be worth checking out this graph of its long term earnings trend.
Finally, while the tax-man may adore accounting profits, lenders only accept cold hard cash. While Trinity Exploration & Production has net cash on its balance sheet, it's still worth taking a look at its ability to convert earnings before interest and tax (EBIT) to free cash flow, to help us understand how quickly it is building (or eroding) that cash balance. Over the last two years, Trinity Exploration & Production saw substantial negative free cash flow, in total. While investors are no doubt expecting a reversal of that situation in due course, it clearly does mean its use of debt is more risky.
Summing Up
Although Trinity Exploration & Production's balance sheet isn't particularly strong, due to the total liabilities, it is clearly positive to see that it has net cash of US$9.30m. And we liked the look of last year's 35% year-on-year EBIT growth. So while Trinity Exploration & Production does not have a great balance sheet, it's certainly not too bad. When analysing debt levels, the balance sheet is the obvious place to start. However, not all investment risk resides within the balance sheet - far from it. For instance, we've identified 3 warning signs for Trinity Exploration & Production that you should be aware of.
Of course, if you're the type of investor who prefers buying stocks without the burden of debt, then don't hesitate to discover our exclusive list of net cash growth stocks, today.
Valuation is complex, but we're here to simplify it.
Discover if Trinity Exploration & Production might be undervalued or overvalued with our detailed analysis, featuring fair value estimates, potential risks, dividends, insider trades, and its financial condition.
Access Free AnalysisHave feedback on this article? Concerned about the content? Get in touch with us directly. Alternatively, email editorial-team (at) simplywallst.com.
This article by Simply Wall St is general in nature. We provide commentary based on historical data and analyst forecasts only using an unbiased methodology and our articles are not intended to be financial advice. It does not constitute a recommendation to buy or sell any stock, and does not take account of your objectives, or your financial situation. We aim to bring you long-term focused analysis driven by fundamental data. Note that our analysis may not factor in the latest price-sensitive company announcements or qualitative material. Simply Wall St has no position in any stocks mentioned.
About AIM:TRIN
Trinity Exploration & Production
An independent oil company, engages in the exploration, development, and production of crude oil in Trinidad & Tobago.
Slightly overvalued with imperfect balance sheet.
Market Insights

Advertisement
Community Narratives
MINISO's fair value is projected at 26.69 with an anticipated PE ratio shift of 20x
Fair Value US$24.03|9.0% undervalued
BE
Community Contributor
Procter & Gamble: A Dividend Giant Facing Slowing Growth
Fair Value US$119.81|23.5% overvalued
AN
Community Contributor
Eli Lilly's Future Growth Driven by Tirzepatide and Favorable Market Conditions
Fair Value US$1.19k|14.4% undervalued
EA
Community Contributor