
Advertisement
The external fund manager backed by Berkshire Hathaway's Charlie Munger, Li Lu, makes no bones about it when he says 'The biggest investment risk is not the volatility of prices, but whether you will suffer a permanent loss of capital.' It's only natural to consider a company's balance sheet when you examine how risky it is, since debt is often involved when a business collapses. We can see that Tekmar Group plc (LON:TGP) does use debt in its business. But the real question is whether this debt is making the company risky.
When Is Debt Dangerous?
Debt is a tool to help businesses grow, but if a business is incapable of paying off its lenders, then it exists at their mercy. Ultimately, if the company can't fulfill its legal obligations to repay debt, shareholders could walk away with nothing. However, a more usual (but still expensive) situation is where a company must dilute shareholders at a cheap share price simply to get debt under control. Having said that, the most common situation is where a company manages its debt reasonably well - and to its own advantage. The first step when considering a company's debt levels is to consider its cash and debt together.
What Is Tekmar Group's Net Debt?
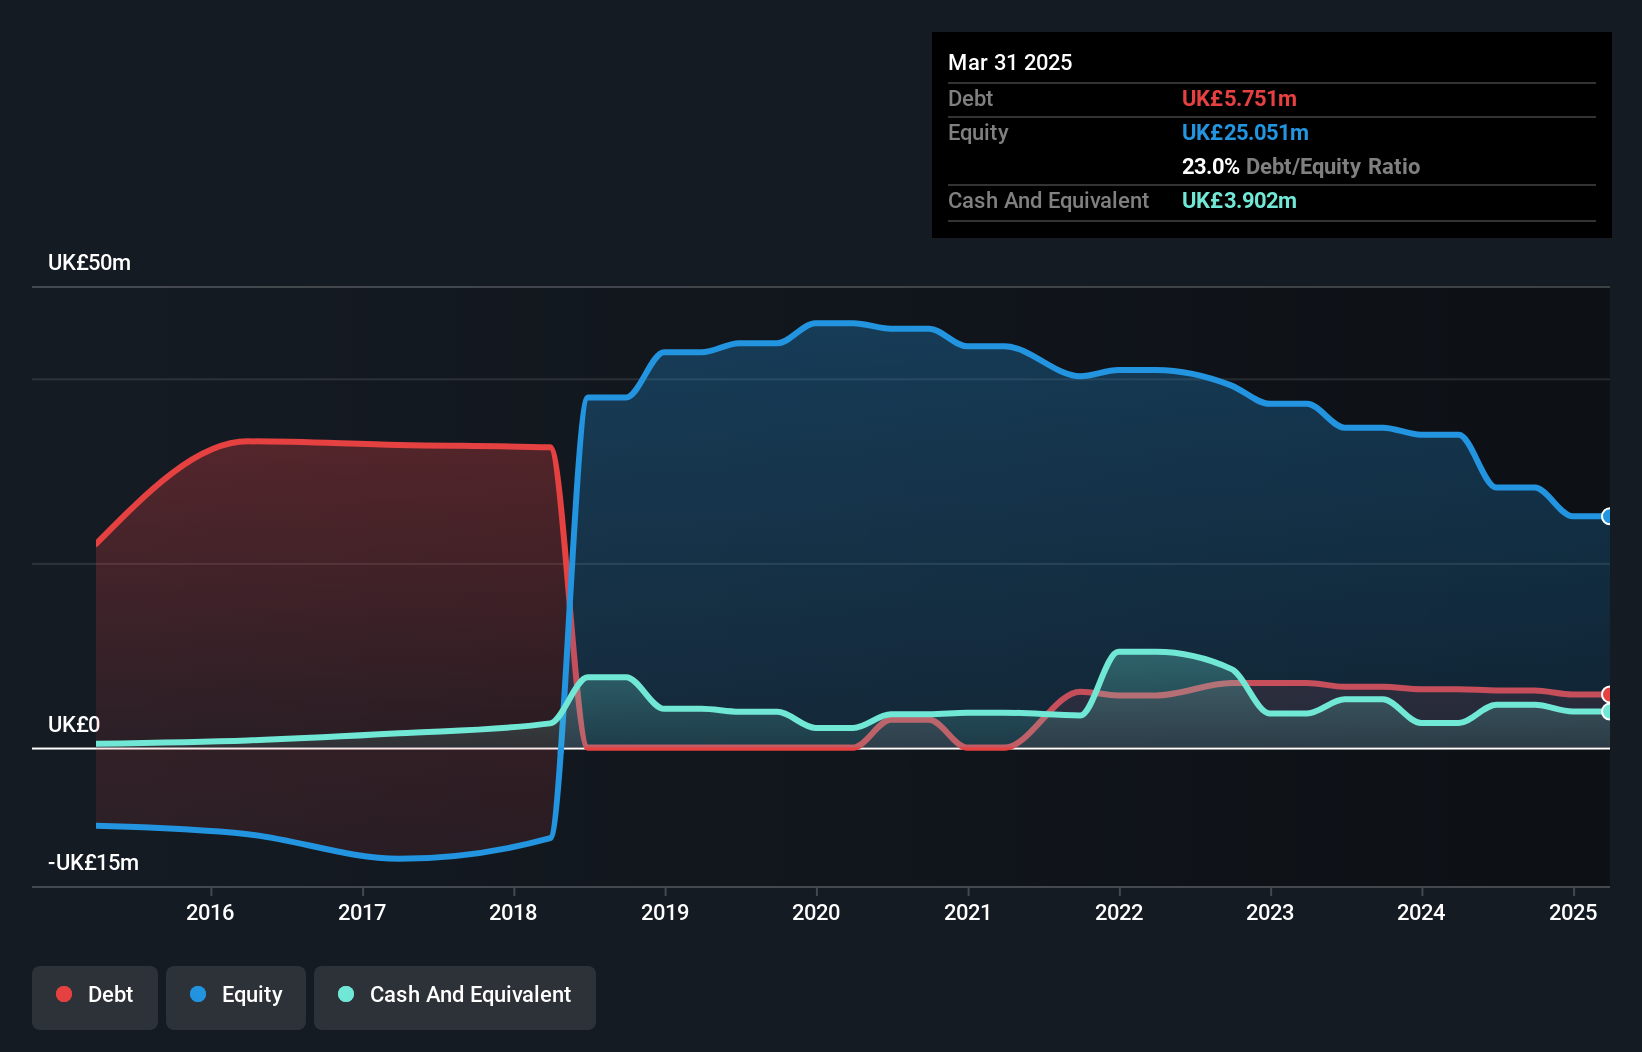
The image below, which you can click on for greater detail, shows that Tekmar Group had debt of UK£5.75m at the end of March 2025, a reduction from UK£6.31m over a year. However, because it has a cash reserve of UK£3.90m, its net debt is less, at about UK£1.85m.
A Look At Tekmar Group's Liabilities
According to the last reported balance sheet, Tekmar Group had liabilities of UK£16.6m due within 12 months, and liabilities of UK£1.65m due beyond 12 months. Offsetting these obligations, it had cash of UK£3.90m as well as receivables valued at UK£12.9m due within 12 months. So its liabilities outweigh the sum of its cash and (near-term) receivables by UK£1.37m.
While this might seem like a lot, it is not so bad since Tekmar Group has a market capitalization of UK£6.38m, and so it could probably strengthen its balance sheet by raising capital if it needed to. However, it is still worthwhile taking a close look at its ability to pay off debt. When analysing debt levels, the balance sheet is the obvious place to start. But ultimately the future profitability of the business will decide if Tekmar Group can strengthen its balance sheet over time. So if you're focused on the future you can check out this free report showing analyst profit forecasts.
View our latest analysis for Tekmar Group
Over 12 months, Tekmar Group made a loss at the EBIT level, and saw its revenue drop to UK£29m, which is a fall of 19%. We would much prefer see growth.
Caveat Emptor
Not only did Tekmar Group's revenue slip over the last twelve months, but it also produced negative earnings before interest and tax (EBIT). Indeed, it lost a very considerable UK£6.2m at the EBIT level. Considering that alongside the liabilities mentioned above does not give us much confidence that company should be using so much debt. Quite frankly we think the balance sheet is far from match-fit, although it could be improved with time. For example, we would not want to see a repeat of last year's loss of UK£7.4m. So in short it's a really risky stock. There's no doubt that we learn most about debt from the balance sheet. But ultimately, every company can contain risks that exist outside of the balance sheet. For instance, we've identified 1 warning sign for Tekmar Group that you should be aware of.
If you're interested in investing in businesses that can grow profits without the burden of debt, then check out this free list of growing businesses that have net cash on the balance sheet.
Valuation is complex, but we're here to simplify it.
Discover if Tekmar Group might be undervalued or overvalued with our detailed analysis, featuring fair value estimates, potential risks, dividends, insider trades, and its financial condition.
Access Free AnalysisHave feedback on this article? Concerned about the content? Get in touch with us directly. Alternatively, email editorial-team (at) simplywallst.com.
This article by Simply Wall St is general in nature. We provide commentary based on historical data and analyst forecasts only using an unbiased methodology and our articles are not intended to be financial advice. It does not constitute a recommendation to buy or sell any stock, and does not take account of your objectives, or your financial situation. We aim to bring you long-term focused analysis driven by fundamental data. Note that our analysis may not factor in the latest price-sensitive company announcements or qualitative material. Simply Wall St has no position in any stocks mentioned.
About AIM:TGP
Tekmar Group
Designs, manufactures, and supplies subsea stability and protection technology to offshore energy markets.
Undervalued with high growth potential.
Market Insights

Advertisement
Community Narratives
The company that turned a verb into a global necessity and basically runs the modern internet, digital ads, smartphones, maps, and AI.
Fair Value US$300.00|5.1% undervalued
OS
Community Contributor
Flowers Foods Pays A Fair Price For Health
Fair Value US$16.12|27.7% undervalued
NV
Community Contributor
TMX Group will thrive with 33.3% profit margin and enduring market moat
Fair Value CA$49.90|0.2% overvalued
LI
Community Contributor
The "Molecular Pencil": Why Beam's Technology is Built to Win
Fair Value US$65.01|64.4% undervalued
DA
Community Contributor