Stock Analysis
- United Kingdom
- /
- Capital Markets
- /
- AIM:TAM
Tatton Asset Management (LON:TAM) stock performs better than its underlying earnings growth over last five years


The most you can lose on any stock (assuming you don't use leverage) is 100% of your money. But on a lighter note, a good company can see its share price rise well over 100%. One great example is Tatton Asset Management plc (LON:TAM) which saw its share price drive 121% higher over five years. On top of that, the share price is up 14% in about a quarter.
Since the stock has added UK£33m to its market cap in the past week alone, let's see if underlying performance has been driving long-term returns.
Check out our latest analysis for Tatton Asset Management
There is no denying that markets are sometimes efficient, but prices do not always reflect underlying business performance. One way to examine how market sentiment has changed over time is to look at the interaction between a company's share price and its earnings per share (EPS).
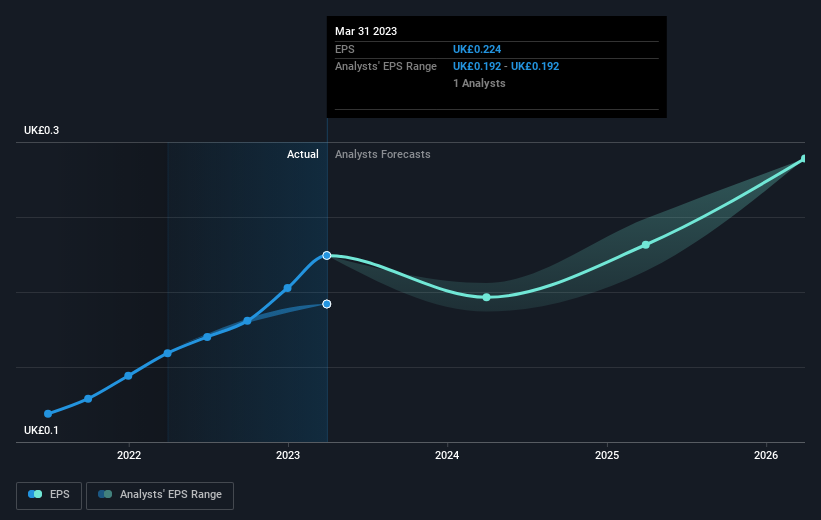
During five years of share price growth, Tatton Asset Management achieved compound earnings per share (EPS) growth of 38% per year. This EPS growth is higher than the 17% average annual increase in the share price. So one could conclude that the broader market has become more cautious towards the stock.
The image below shows how EPS has tracked over time (if you click on the image you can see greater detail).
It's probably worth noting that the CEO is paid less than the median at similar sized companies. But while CEO remuneration is always worth checking, the really important question is whether the company can grow earnings going forward. This free interactive report on Tatton Asset Management's earnings, revenue and cash flow is a great place to start, if you want to investigate the stock further.
What About Dividends?
It is important to consider the total shareholder return, as well as the share price return, for any given stock. The TSR incorporates the value of any spin-offs or discounted capital raisings, along with any dividends, based on the assumption that the dividends are reinvested. Arguably, the TSR gives a more comprehensive picture of the return generated by a stock. We note that for Tatton Asset Management the TSR over the last 5 years was 161%, which is better than the share price return mentioned above. And there's no prize for guessing that the dividend payments largely explain the divergence!
A Different Perspective
It's good to see that Tatton Asset Management has rewarded shareholders with a total shareholder return of 41% in the last twelve months. And that does include the dividend. That's better than the annualised return of 21% over half a decade, implying that the company is doing better recently. Someone with an optimistic perspective could view the recent improvement in TSR as indicating that the business itself is getting better with time. It's always interesting to track share price performance over the longer term. But to understand Tatton Asset Management better, we need to consider many other factors. For instance, we've identified 1 warning sign for Tatton Asset Management that you should be aware of.
For those who like to find winning investments this free list of growing companies with recent insider purchasing, could be just the ticket.
Please note, the market returns quoted in this article reflect the market weighted average returns of stocks that currently trade on British exchanges.
Valuation is complex, but we're helping make it simple.
Find out whether Tatton Asset Management is potentially over or undervalued by checking out our comprehensive analysis, which includes fair value estimates, risks and warnings, dividends, insider transactions and financial health.
View the Free AnalysisHave feedback on this article? Concerned about the content? Get in touch with us directly. Alternatively, email editorial-team (at) simplywallst.com.
This article by Simply Wall St is general in nature. We provide commentary based on historical data and analyst forecasts only using an unbiased methodology and our articles are not intended to be financial advice. It does not constitute a recommendation to buy or sell any stock, and does not take account of your objectives, or your financial situation. We aim to bring you long-term focused analysis driven by fundamental data. Note that our analysis may not factor in the latest price-sensitive company announcements or qualitative material. Simply Wall St has no position in any stocks mentioned.
About AIM:TAM
Tatton Asset Management
Engages in the provision of discretionary fund management, compliance consultancy, and technical support services to independent financial advisers in the United Kingdom.
Flawless balance sheet with moderate growth potential.
