Stock Analysis
- United Kingdom
- /
- Capital Markets
- /
- AIM:IPX
Impax Asset Management Group's (LON:IPX) earnings growth rate lags the 16% CAGR delivered to shareholders


Impax Asset Management Group Plc (LON:IPX) shareholders might be concerned after seeing the share price drop 17% in the last quarter. But that doesn't change the fact that the returns over the last five years have been pleasing. Its return of 80% has certainly bested the market return! Unfortunately not all shareholders will have held it for the long term, so spare a thought for those caught in the 45% decline over the last twelve months.
While the stock has fallen 7.0% this week, it's worth focusing on the longer term and seeing if the stocks historical returns have been driven by the underlying fundamentals.
View our latest analysis for Impax Asset Management Group
To quote Buffett, 'Ships will sail around the world but the Flat Earth Society will flourish. There will continue to be wide discrepancies between price and value in the marketplace...' One flawed but reasonable way to assess how sentiment around a company has changed is to compare the earnings per share (EPS) with the share price.
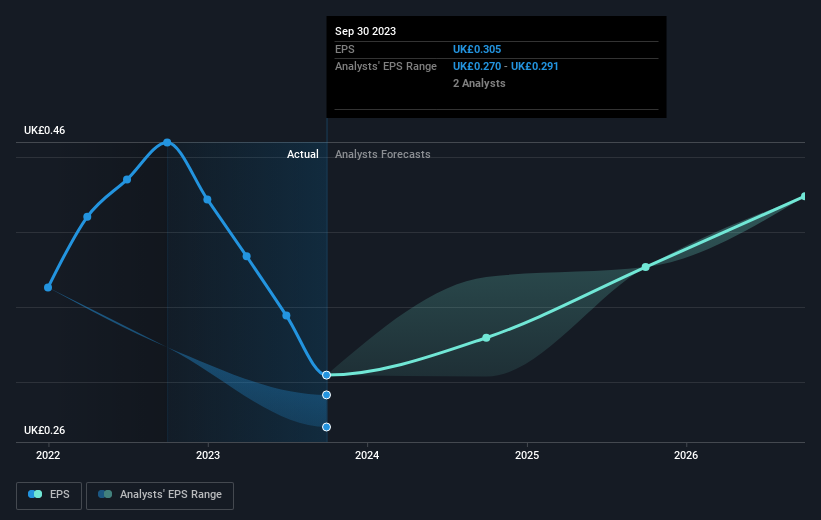
Over half a decade, Impax Asset Management Group managed to grow its earnings per share at 28% a year. The EPS growth is more impressive than the yearly share price gain of 12% over the same period. So one could conclude that the broader market has become more cautious towards the stock.
You can see how EPS has changed over time in the image below (click on the chart to see the exact values).
We consider it positive that insiders have made significant purchases in the last year. Even so, future earnings will be far more important to whether current shareholders make money. Dive deeper into the earnings by checking this interactive graph of Impax Asset Management Group's earnings, revenue and cash flow.
What About Dividends?
As well as measuring the share price return, investors should also consider the total shareholder return (TSR). Whereas the share price return only reflects the change in the share price, the TSR includes the value of dividends (assuming they were reinvested) and the benefit of any discounted capital raising or spin-off. So for companies that pay a generous dividend, the TSR is often a lot higher than the share price return. We note that for Impax Asset Management Group the TSR over the last 5 years was 106%, which is better than the share price return mentioned above. And there's no prize for guessing that the dividend payments largely explain the divergence!
A Different Perspective
Impax Asset Management Group shareholders are down 42% for the year (even including dividends), but the market itself is up 4.7%. However, keep in mind that even the best stocks will sometimes underperform the market over a twelve month period. On the bright side, long term shareholders have made money, with a gain of 16% per year over half a decade. If the fundamental data continues to indicate long term sustainable growth, the current sell-off could be an opportunity worth considering. I find it very interesting to look at share price over the long term as a proxy for business performance. But to truly gain insight, we need to consider other information, too. Take risks, for example - Impax Asset Management Group has 3 warning signs (and 1 which doesn't sit too well with us) we think you should know about.
There are plenty of other companies that have insiders buying up shares. You probably do not want to miss this free list of growing companies that insiders are buying.
Please note, the market returns quoted in this article reflect the market weighted average returns of stocks that currently trade on British exchanges.
Valuation is complex, but we're helping make it simple.
Find out whether Impax Asset Management Group is potentially over or undervalued by checking out our comprehensive analysis, which includes fair value estimates, risks and warnings, dividends, insider transactions and financial health.
View the Free AnalysisHave feedback on this article? Concerned about the content? Get in touch with us directly. Alternatively, email editorial-team (at) simplywallst.com.
This article by Simply Wall St is general in nature. We provide commentary based on historical data and analyst forecasts only using an unbiased methodology and our articles are not intended to be financial advice. It does not constitute a recommendation to buy or sell any stock, and does not take account of your objectives, or your financial situation. We aim to bring you long-term focused analysis driven by fundamental data. Note that our analysis may not factor in the latest price-sensitive company announcements or qualitative material. Simply Wall St has no position in any stocks mentioned.
About AIM:IPX
Flawless balance sheet, undervalued and pays a dividend.
