- United Kingdom
- /
- Capital Markets
- /
- AIM:BPM
A Quick Analysis On B.P. Marsh & Partners' (LON:BPM) CEO Salary
Alice Hannah Foulk became the CEO of B.P. Marsh & Partners PLC (LON:BPM) in 2016, and we think it's a good time to look at the executive's compensation against the backdrop of overall company performance. This analysis will also look to assess whether the CEO is appropriately paid, considering recent earnings growth and investor returns for B.P. Marsh & Partners.
View our latest analysis for B.P. Marsh & Partners
Comparing B.P. Marsh & Partners PLC's CEO Compensation With the industry
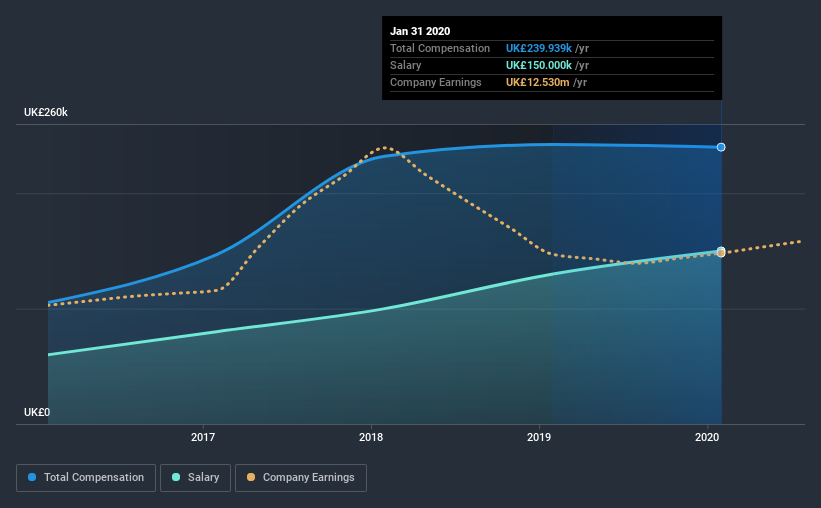
At the time of writing, our data shows that B.P. Marsh & Partners PLC has a market capitalization of UK£98m, and reported total annual CEO compensation of UK£240k for the year to January 2020. That's mostly flat as compared to the prior year's compensation. Notably, the salary which is UK£150.0k, represents most of the total compensation being paid.
In comparison with other companies in the industry with market capitalizations under UK£147m, the reported median total CEO compensation was UK£243k. From this we gather that Alice Hannah Foulk is paid around the median for CEOs in the industry. What's more, Alice Hannah Foulk holds UK£116k worth of shares in the company in their own name.
| Component | 2020 | 2019 | Proportion (2020) |
| Salary | UK£150k | UK£130k | 63% |
| Other | UK£90k | UK£112k | 37% |
| Total Compensation | UK£240k | UK£242k | 100% |
Speaking on an industry level, nearly 49% of total compensation represents salary, while the remainder of 51% is other remuneration. B.P. Marsh & Partners pays out 63% of remuneration in the form of a salary, significantly higher than the industry average. If total compensation veers towards salary, it suggests that the variable portion - which is generally tied to performance, is lower.

B.P. Marsh & Partners PLC's Growth
Over the last three years, B.P. Marsh & Partners PLC has shrunk its earnings per share by 12% per year. Its revenue is up 17% over the last year.
The reduction in EPS, over three years, is arguably concerning. On the other hand, the strong revenue growth suggests the business is growing. In conclusion we can't form a strong opinion about business performance yet; but it's one worth watching. While we don't have analyst forecasts for the company, shareholders might want to examine this detailed historical graph of earnings, revenue and cash flow.
Has B.P. Marsh & Partners PLC Been A Good Investment?
B.P. Marsh & Partners PLC has generated a total shareholder return of 8.2% over three years, so most shareholders wouldn't be too disappointed. But they would probably prefer not to see CEO compensation far in excess of the median.
In Summary...
As we touched on above, B.P. Marsh & Partners PLC is currently paying a compensation that's close to the median pay for CEOs of companies belonging to the same industry and with similar market capitalizations. But revenue growth over the last year can't be ignored. Shareholder returns, in comparison, have not been as impressive during the same period. An additional worry is EPS , which has posted negative growth in the previous three years. There's certainly room for improvement, but CEO compensation seems reasonable, considering the company's steady performance.
If you think CEO compensation levels are interesting you will probably really like this free visualization of insider trading at B.P. Marsh & Partners.
Of course, you might find a fantastic investment by looking at a different set of stocks. So take a peek at this free list of interesting companies.
If you’re looking to trade B.P. Marsh & Partners, open an account with the lowest-cost* platform trusted by professionals, Interactive Brokers. Their clients from over 200 countries and territories trade stocks, options, futures, forex, bonds and funds worldwide from a single integrated account. Promoted
Valuation is complex, but we're here to simplify it.
Discover if B.P. Marsh & Partners might be undervalued or overvalued with our detailed analysis, featuring fair value estimates, potential risks, dividends, insider trades, and its financial condition.
Access Free AnalysisThis article by Simply Wall St is general in nature. It does not constitute a recommendation to buy or sell any stock, and does not take account of your objectives, or your financial situation. We aim to bring you long-term focused analysis driven by fundamental data. Note that our analysis may not factor in the latest price-sensitive company announcements or qualitative material. Simply Wall St has no position in any stocks mentioned.
*Interactive Brokers Rated Lowest Cost Broker by StockBrokers.com Annual Online Review 2020
Have feedback on this article? Concerned about the content? Get in touch with us directly. Alternatively, email editorial-team (at) simplywallst.com.
About AIM:BPM
B.P. Marsh & Partners
Invests in early-stage and SME financial services intermediary businesses in the United Kingdom and internationally.
Flawless balance sheet with solid track record.
Market Insights
Community Narratives


Recently Updated Narratives


Alphabet: The Under-appreciated Compounder Hiding in Plain Sight


MINISO's fair value is projected at 26.69 with an anticipated PE ratio shift of 20x


The Quiet Giant That Became AI’s Power Grid
Popular Narratives


The company that turned a verb into a global necessity and basically runs the modern internet, digital ads, smartphones, maps, and AI.


MicroVision will explode future revenue by 380.37% with a vision towards success


