
Advertisement
- United Kingdom
- /
- Hospitality
- /
- AIM:NXQ
Quixant Plc's (LON:QXT) Stock is Soaring But Financials Seem Inconsistent: Will The Uptrend Continue?
Quixant (LON:QXT) has had a great run on the share market with its stock up by a significant 18% over the last three months. However, we decided to pay attention to the company's fundamentals which don't appear to give a clear sign about the company's financial health. In this article, we decided to focus on Quixant's ROE.
Return on equity or ROE is an important factor to be considered by a shareholder because it tells them how effectively their capital is being reinvested. In simpler terms, it measures the profitability of a company in relation to shareholder's equity.
See our latest analysis for Quixant
How To Calculate Return On Equity?
ROE can be calculated by using the formula:
Return on Equity = Net Profit (from continuing operations) ÷ Shareholders' Equity
So, based on the above formula, the ROE for Quixant is:
4.8% = US$3.0m ÷ US$62m (Based on the trailing twelve months to June 2020).
The 'return' is the income the business earned over the last year. That means that for every £1 worth of shareholders' equity, the company generated £0.05 in profit.
Why Is ROE Important For Earnings Growth?
So far, we've learned that ROE is a measure of a company's profitability. Based on how much of its profits the company chooses to reinvest or "retain", we are then able to evaluate a company's future ability to generate profits. Assuming everything else remains unchanged, the higher the ROE and profit retention, the higher the growth rate of a company compared to companies that don't necessarily bear these characteristics.
Quixant's Earnings Growth And 4.8% ROE
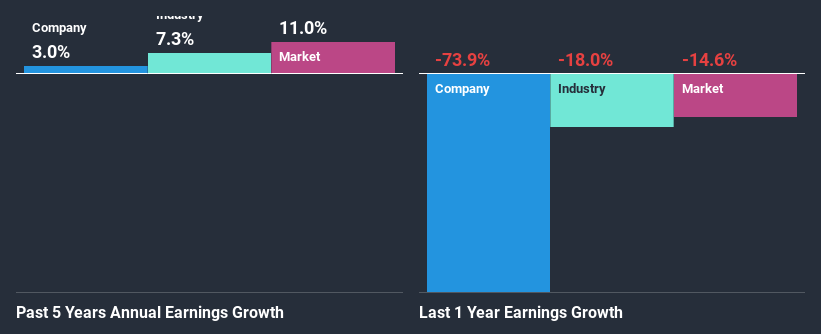
At first glance, Quixant's ROE doesn't look very promising. Yet, a closer study shows that the company's ROE is similar to the industry average of 5.6%. We can see that Quixant has grown at a five year net income growth average rate of 3.0%, which is a bit on the lower side. Remember, the company's ROE is not particularly great to begin with. Hence, this does provide some context to low earnings growth seen by the company.
We then compared Quixant's net income growth with the industry and found that the company's growth figure is lower than the average industry growth rate of 7.3% in the same period, which is a bit concerning.
The basis for attaching value to a company is, to a great extent, tied to its earnings growth. What investors need to determine next is if the expected earnings growth, or the lack of it, is already built into the share price. Doing so will help them establish if the stock's future looks promising or ominous. One good indicator of expected earnings growth is the P/E ratio which determines the price the market is willing to pay for a stock based on its earnings prospects. So, you may want to check if Quixant is trading on a high P/E or a low P/E, relative to its industry.
Is Quixant Efficiently Re-investing Its Profits?
While the company did pay out a portion of its dividend in the past, it currently doesn't pay a dividend. We infer that the company has been reinvesting all of its profits to grow its business.
Upon studying the latest analysts' consensus data, we found that the company is expected to keep paying out approximately 15% of its profits over the next three years.
Conclusion
Overall, we have mixed feelings about Quixant. Even though it appears to be retaining most of its profits, given the low ROE, investors may not be benefitting from all that reinvestment after all. The low earnings growth suggests our theory correct. With that said, the latest industry analyst forecasts reveal that the company's earnings are expected to accelerate. To know more about the company's future earnings growth forecasts take a look at this free report on analyst forecasts for the company to find out more.
If you decide to trade Quixant, use the lowest-cost* platform that is rated #1 Overall by Barron’s, Interactive Brokers. Trade stocks, options, futures, forex, bonds and funds on 135 markets, all from a single integrated account. Promoted
Valuation is complex, but we're here to simplify it.
Discover if Nexteq might be undervalued or overvalued with our detailed analysis, featuring fair value estimates, potential risks, dividends, insider trades, and its financial condition.
Access Free AnalysisThis article by Simply Wall St is general in nature. It does not constitute a recommendation to buy or sell any stock, and does not take account of your objectives, or your financial situation. We aim to bring you long-term focused analysis driven by fundamental data. Note that our analysis may not factor in the latest price-sensitive company announcements or qualitative material. Simply Wall St has no position in any stocks mentioned.
*Interactive Brokers Rated Lowest Cost Broker by StockBrokers.com Annual Online Review 2020
Have feedback on this article? Concerned about the content? Get in touch with us directly. Alternatively, email editorial-team (at) simplywallst.com.
About AIM:NXQ
Nexteq
Operates as a technology solution provider to customers in industrial markets in North America, Asia, Australia, the United Kingdom, rest of Europe, and internationally.
Excellent balance sheet with reasonable growth potential.
Market Insights

Advertisement
Community Narratives
MicroVision will explode future revenue by 380.37% with a vision towards success
Fair Value US$60|98.4% undervalued
TH
Community Contributor
The Indispensable Artery for a New North American Economy
Fair Value CA$132.87|1.6% undervalued
TI
Community Contributor
Recently Updated Narratives
BE


Bejgal on MINISO Group Holding ·
MINISO's fair value is projected at 26.69 with an anticipated PE ratio shift of 20x
Fair Value:US$26.6928.0% undervalued
44 followersusers have followed this narrative
3 commentsusers have commented on this narrative
0 likesusers have liked this narrative
TI


TickerTickle on Oracle ·
The Quiet Giant That Became AI’s Power Grid
Fair Value:US$389.8149.5% undervalued
7 followersusers have followed this narrative
1 commentusers have commented on this narrative
0 likesusers have liked this narrative
AU

AuCA on Nova Ljubljanska Banka d.d ·
Nova Ljubljanska Banka d.d will expect a 11.2% revenue boost driving future growth
Fair Value:€20916.3% undervalued
23 followersusers have followed this narrative
3 commentsusers have commented on this narrative
0 likesusers have liked this narrative
Popular Narratives
OS


oscargarcia on Alphabet ·
The company that turned a verb into a global necessity and basically runs the modern internet, digital ads, smartphones, maps, and AI.
Fair Value:US$3404.9% undervalued
134 followersusers have followed this narrative
6 commentsusers have commented on this narrative
18 likesusers have liked this narrative
TH

TheWallstreetKing on MicroVision ·
MicroVision will explode future revenue by 380.37% with a vision towards success
Fair Value:US$6098.4% undervalued
83 followersusers have followed this narrative
11 commentsusers have commented on this narrative
18 likesusers have liked this narrative
AN


AnalystConsensusTarget on NVIDIA ·
NVDA: Expanding AI Demand Will Drive Major Data Center Investments Through 2026
Fair Value:US$232.7923.6% undervalued
923 followersusers have followed this narrative
5 commentsusers have commented on this narrative
22 likesusers have liked this narrative