Stock Analysis
- United Kingdom
- /
- Food and Staples Retail
- /
- LSE:TSCO
Investors in Tesco (LON:TSCO) have seen notable returns of 48% over the past three years

By buying an index fund, investors can approximate the average market return. But many of us dare to dream of bigger returns, and build a portfolio ourselves. For example, the Tesco PLC (LON:TSCO) share price is up 31% in the last three years, clearly besting the market return of around 0.8% (not including dividends). On the other hand, the returns haven't been quite so good recently, with shareholders up just 16% , including dividends .
Now it's worth having a look at the company's fundamentals too, because that will help us determine if the long term shareholder return has matched the performance of the underlying business.
Check out our latest analysis for Tesco
To paraphrase Benjamin Graham: Over the short term the market is a voting machine, but over the long term it's a weighing machine. One way to examine how market sentiment has changed over time is to look at the interaction between a company's share price and its earnings per share (EPS).
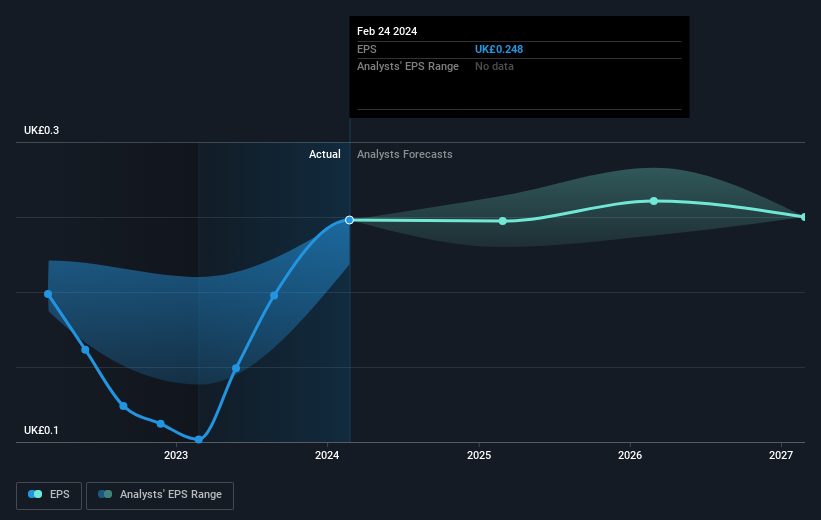
During three years of share price growth, Tesco achieved compound earnings per share growth of 54% per year. This EPS growth is higher than the 9% average annual increase in the share price. So one could reasonably conclude that the market has cooled on the stock. We'd venture the lowish P/E ratio of 11.79 also reflects the negative sentiment around the stock.
The image below shows how EPS has tracked over time (if you click on the image you can see greater detail).
We know that Tesco has improved its bottom line over the last three years, but what does the future have in store? If you are thinking of buying or selling Tesco stock, you should check out this FREE detailed report on its balance sheet.
What About Dividends?
As well as measuring the share price return, investors should also consider the total shareholder return (TSR). The TSR is a return calculation that accounts for the value of cash dividends (assuming that any dividend received was reinvested) and the calculated value of any discounted capital raisings and spin-offs. Arguably, the TSR gives a more comprehensive picture of the return generated by a stock. In the case of Tesco, it has a TSR of 48% for the last 3 years. That exceeds its share price return that we previously mentioned. The dividends paid by the company have thusly boosted the total shareholder return.
A Different Perspective
We're pleased to report that Tesco shareholders have received a total shareholder return of 16% over one year. That's including the dividend. Since the one-year TSR is better than the five-year TSR (the latter coming in at 8% per year), it would seem that the stock's performance has improved in recent times. In the best case scenario, this may hint at some real business momentum, implying that now could be a great time to delve deeper. It's always interesting to track share price performance over the longer term. But to understand Tesco better, we need to consider many other factors. Consider risks, for instance. Every company has them, and we've spotted 1 warning sign for Tesco you should know about.
But note: Tesco may not be the best stock to buy. So take a peek at this free list of interesting companies with past earnings growth (and further growth forecast).
Please note, the market returns quoted in this article reflect the market weighted average returns of stocks that currently trade on British exchanges.
Valuation is complex, but we're helping make it simple.
Find out whether Tesco is potentially over or undervalued by checking out our comprehensive analysis, which includes fair value estimates, risks and warnings, dividends, insider transactions and financial health.
View the Free AnalysisHave feedback on this article? Concerned about the content? Get in touch with us directly. Alternatively, email editorial-team (at) simplywallst.com.
This article by Simply Wall St is general in nature. We provide commentary based on historical data and analyst forecasts only using an unbiased methodology and our articles are not intended to be financial advice. It does not constitute a recommendation to buy or sell any stock, and does not take account of your objectives, or your financial situation. We aim to bring you long-term focused analysis driven by fundamental data. Note that our analysis may not factor in the latest price-sensitive company announcements or qualitative material. Simply Wall St has no position in any stocks mentioned.
About LSE:TSCO
Tesco
Tesco PLC, together with its subsidiaries, operates as a grocery retailer in the United Kingdom, Republic of Ireland, the Czech Republic, Slovakia, and Hungary.
Undervalued with solid track record.
