
Advertisement
Some say volatility, rather than debt, is the best way to think about risk as an investor, but Warren Buffett famously said that 'Volatility is far from synonymous with risk.' When we think about how risky a company is, we always like to look at its use of debt, since debt overload can lead to ruin. We note that J Sainsbury plc (LON:SBRY) does have debt on its balance sheet. But the more important question is: how much risk is that debt creating?
Why Does Debt Bring Risk?
Generally speaking, debt only becomes a real problem when a company can't easily pay it off, either by raising capital or with its own cash flow. In the worst case scenario, a company can go bankrupt if it cannot pay its creditors. However, a more usual (but still expensive) situation is where a company must dilute shareholders at a cheap share price simply to get debt under control. Of course, debt can be an important tool in businesses, particularly capital heavy businesses. When we examine debt levels, we first consider both cash and debt levels, together.
Check out our latest analysis for J Sainsbury
What Is J Sainsbury's Net Debt?
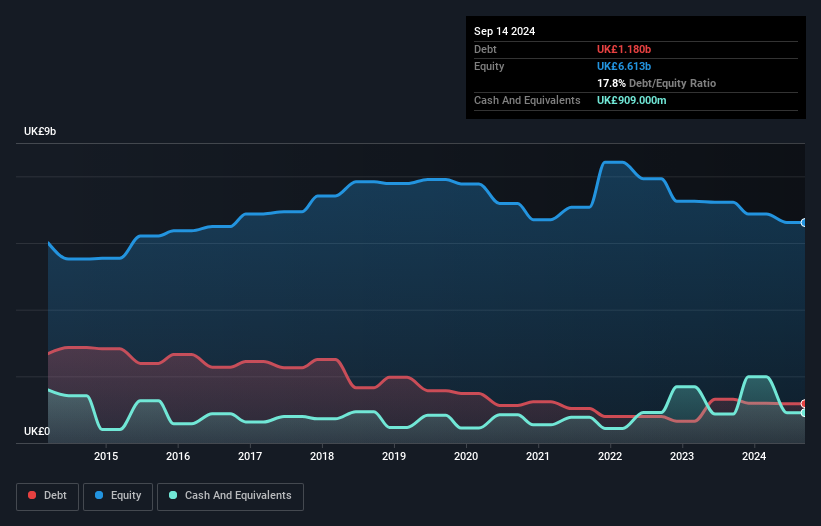
The image below, which you can click on for greater detail, shows that J Sainsbury had debt of UK£1.18b at the end of September 2024, a reduction from UK£1.32b over a year. On the flip side, it has UK£909.0m in cash leading to net debt of about UK£271.0m.
How Strong Is J Sainsbury's Balance Sheet?
We can see from the most recent balance sheet that J Sainsbury had liabilities of UK£11.3b falling due within a year, and liabilities of UK£6.70b due beyond that. Offsetting this, it had UK£909.0m in cash and UK£683.0m in receivables that were due within 12 months. So its liabilities outweigh the sum of its cash and (near-term) receivables by UK£16.4b.
The deficiency here weighs heavily on the UK£6.07b company itself, as if a child were struggling under the weight of an enormous back-pack full of books, his sports gear, and a trumpet. So we'd watch its balance sheet closely, without a doubt. After all, J Sainsbury would likely require a major re-capitalisation if it had to pay its creditors today.
We use two main ratios to inform us about debt levels relative to earnings. The first is net debt divided by earnings before interest, tax, depreciation, and amortization (EBITDA), while the second is how many times its earnings before interest and tax (EBIT) covers its interest expense (or its interest cover, for short). Thus we consider debt relative to earnings both with and without depreciation and amortization expenses.
While J Sainsbury's low debt to EBITDA ratio of 0.13 suggests only modest use of debt, the fact that EBIT only covered the interest expense by 4.7 times last year does give us pause. So we'd recommend keeping a close eye on the impact financing costs are having on the business. Also relevant is that J Sainsbury has grown its EBIT by a very respectable 23% in the last year, thus enhancing its ability to pay down debt. The balance sheet is clearly the area to focus on when you are analysing debt. But ultimately the future profitability of the business will decide if J Sainsbury can strengthen its balance sheet over time. So if you're focused on the future you can check out this free report showing analyst profit forecasts.
Finally, a business needs free cash flow to pay off debt; accounting profits just don't cut it. So the logical step is to look at the proportion of that EBIT that is matched by actual free cash flow. Looking at the most recent three years, J Sainsbury recorded free cash flow of 48% of its EBIT, which is weaker than we'd expect. That's not great, when it comes to paying down debt.
Our View
J Sainsbury's level of total liabilities was a real negative on this analysis, although the other factors we considered cast it in a significantly better light. For example its net debt to EBITDA was refreshing. When we consider all the factors discussed, it seems to us that J Sainsbury is taking some risks with its use of debt. So while that leverage does boost returns on equity, we wouldn't really want to see it increase from here. There's no doubt that we learn most about debt from the balance sheet. But ultimately, every company can contain risks that exist outside of the balance sheet. These risks can be hard to spot. Every company has them, and we've spotted 2 warning signs for J Sainsbury (of which 1 is a bit unpleasant!) you should know about.
At the end of the day, it's often better to focus on companies that are free from net debt. You can access our special list of such companies (all with a track record of profit growth). It's free.
New: Manage All Your Stock Portfolios in One Place
We've created the ultimate portfolio companion for stock investors, and it's free.
• Connect an unlimited number of Portfolios and see your total in one currency
• Be alerted to new Warning Signs or Risks via email or mobile
• Track the Fair Value of your stocks
Have feedback on this article? Concerned about the content? Get in touch with us directly. Alternatively, email editorial-team (at) simplywallst.com.
This article by Simply Wall St is general in nature. We provide commentary based on historical data and analyst forecasts only using an unbiased methodology and our articles are not intended to be financial advice. It does not constitute a recommendation to buy or sell any stock, and does not take account of your objectives, or your financial situation. We aim to bring you long-term focused analysis driven by fundamental data. Note that our analysis may not factor in the latest price-sensitive company announcements or qualitative material. Simply Wall St has no position in any stocks mentioned.
About LSE:SBRY
J Sainsbury
Engages in the food, general merchandise and clothing retailing, and financial services activities in the United Kingdom.
Solid track record and fair value.
Similar Companies
Market Insights

Advertisement
Community Narratives
MicroVision will explode future revenue by 380.37% with a vision towards success
Fair Value US$60.00|98.5% undervalued
TH
Community Contributor
The Indispensable Artery for a New North American Economy
Fair Value CA$132.87|2.3% undervalued
TI
Community Contributor