
Advertisement
- United Kingdom
- /
- Professional Services
- /
- LSE:PAGE
PageGroup (LON:PAGE) Is Aiming To Keep Up Its Impressive Returns
To find a multi-bagger stock, what are the underlying trends we should look for in a business? Firstly, we'd want to identify a growing return on capital employed (ROCE) and then alongside that, an ever-increasing base of capital employed. Ultimately, this demonstrates that it's a business that is reinvesting profits at increasing rates of return. So, when we ran our eye over PageGroup's (LON:PAGE) trend of ROCE, we really liked what we saw.
Understanding Return On Capital Employed (ROCE)
Just to clarify if you're unsure, ROCE is a metric for evaluating how much pre-tax income (in percentage terms) a company earns on the capital invested in its business. Analysts use this formula to calculate it for PageGroup:
Return on Capital Employed = Earnings Before Interest and Tax (EBIT) ÷ (Total Assets - Current Liabilities)
0.34 = UK£145m ÷ (UK£731m - UK£310m) (Based on the trailing twelve months to June 2023).
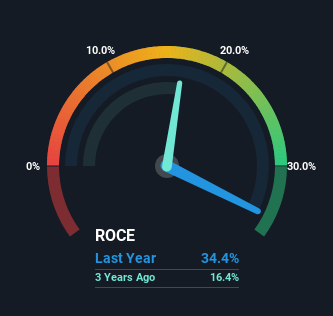
Thus, PageGroup has an ROCE of 34%. In absolute terms that's a great return and it's even better than the Professional Services industry average of 15%.
Check out our latest analysis for PageGroup
Above you can see how the current ROCE for PageGroup compares to its prior returns on capital, but there's only so much you can tell from the past. If you're interested, you can view the analysts predictions in our free report on analyst forecasts for the company.
What Does the ROCE Trend For PageGroup Tell Us?
PageGroup deserves to be commended in regards to it's returns. Over the past five years, ROCE has remained relatively flat at around 34% and the business has deployed 30% more capital into its operations. Returns like this are the envy of most businesses and given it has repeatedly reinvested at these rates, that's even better. If PageGroup can keep this up, we'd be very optimistic about its future.
On a side note, PageGroup's current liabilities are still rather high at 42% of total assets. This effectively means that suppliers (or short-term creditors) are funding a large portion of the business, so just be aware that this can introduce some elements of risk. While it's not necessarily a bad thing, it can be beneficial if this ratio is lower.
In Conclusion...
PageGroup has demonstrated its proficiency by generating high returns on increasing amounts of capital employed, which we're thrilled about. However, over the last five years, the stock has only delivered a 5.7% return to shareholders who held over that period. So because of the trends we're seeing, we'd recommend looking further into this stock to see if it has the makings of a multi-bagger.
On a separate note, we've found 2 warning signs for PageGroup you'll probably want to know about.
High returns are a key ingredient to strong performance, so check out our free list ofstocks earning high returns on equity with solid balance sheets.
New: Manage All Your Stock Portfolios in One Place
We've created the ultimate portfolio companion for stock investors, and it's free.
• Connect an unlimited number of Portfolios and see your total in one currency
• Be alerted to new Warning Signs or Risks via email or mobile
• Track the Fair Value of your stocks
Have feedback on this article? Concerned about the content? Get in touch with us directly. Alternatively, email editorial-team (at) simplywallst.com.
This article by Simply Wall St is general in nature. We provide commentary based on historical data and analyst forecasts only using an unbiased methodology and our articles are not intended to be financial advice. It does not constitute a recommendation to buy or sell any stock, and does not take account of your objectives, or your financial situation. We aim to bring you long-term focused analysis driven by fundamental data. Note that our analysis may not factor in the latest price-sensitive company announcements or qualitative material. Simply Wall St has no position in any stocks mentioned.
About LSE:PAGE
PageGroup
Provides recruitment consultancy and other ancillary services in the United Kingdom, rest of Europe, the Middle East, Africa, the Asia Pacific, and the Americas.
Excellent balance sheet with reasonable growth potential.
Similar Companies
Market Insights

Advertisement
Community Narratives
MicroVision will explode future revenue by 380.37% with a vision towards success
Fair Value US$60.00|98.5% undervalued
TH
Community Contributor
The Indispensable Artery for a New North American Economy
Fair Value CA$132.87|2.3% undervalued
TI
Community Contributor