Stock Analysis
- United Kingdom
- /
- Electrical
- /
- AIM:DWHT
Has Dewhurst Group Plc's (LON:DWHT) Impressive Stock Performance Got Anything to Do With Its Fundamentals?


Dewhurst Group (LON:DWHT) has had a great run on the share market with its stock up by a significant 10.0% over the last week. Given that stock prices are usually aligned with a company's financial performance in the long-term, we decided to study its financial indicators more closely to see if they had a hand to play in the recent price move. Specifically, we decided to study Dewhurst Group's ROE in this article.
ROE or return on equity is a useful tool to assess how effectively a company can generate returns on the investment it received from its shareholders. Simply put, it is used to assess the profitability of a company in relation to its equity capital.
Check out our latest analysis for Dewhurst Group
How To Calculate Return On Equity?
Return on equity can be calculated by using the formula:
Return on Equity = Net Profit (from continuing operations) ÷ Shareholders' Equity
So, based on the above formula, the ROE for Dewhurst Group is:
8.5% = UK£5.1m ÷ UK£60m (Based on the trailing twelve months to September 2023).
The 'return' is the yearly profit. Another way to think of that is that for every £1 worth of equity, the company was able to earn £0.08 in profit.
Why Is ROE Important For Earnings Growth?
So far, we've learned that ROE is a measure of a company's profitability. Depending on how much of these profits the company reinvests or "retains", and how effectively it does so, we are then able to assess a company’s earnings growth potential. Assuming everything else remains unchanged, the higher the ROE and profit retention, the higher the growth rate of a company compared to companies that don't necessarily bear these characteristics.
Dewhurst Group's Earnings Growth And 8.5% ROE
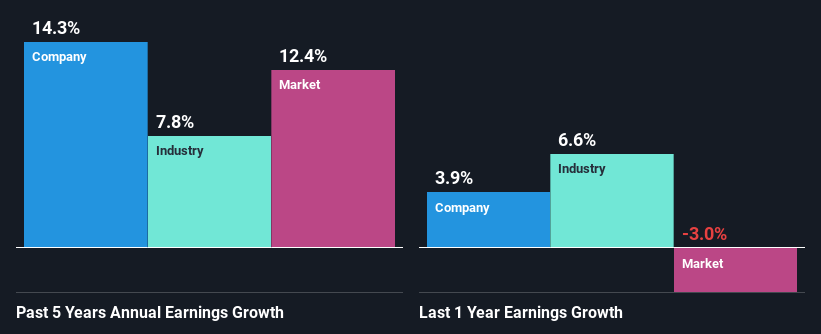
On the face of it, Dewhurst Group's ROE is not much to talk about. We then compared the company's ROE to the broader industry and were disappointed to see that the ROE is lower than the industry average of 12%. Although, we can see that Dewhurst Group saw a modest net income growth of 14% over the past five years. So, the growth in the company's earnings could probably have been caused by other variables. Such as - high earnings retention or an efficient management in place.
We then compared Dewhurst Group's net income growth with the industry and we're pleased to see that the company's growth figure is higher when compared with the industry which has a growth rate of 7.8% in the same 5-year period.
Earnings growth is a huge factor in stock valuation. What investors need to determine next is if the expected earnings growth, or the lack of it, is already built into the share price. By doing so, they will have an idea if the stock is headed into clear blue waters or if swampy waters await. One good indicator of expected earnings growth is the P/E ratio which determines the price the market is willing to pay for a stock based on its earnings prospects. So, you may want to check if Dewhurst Group is trading on a high P/E or a low P/E, relative to its industry.
Is Dewhurst Group Using Its Retained Earnings Effectively?
Dewhurst Group has a low three-year median payout ratio of 24%, meaning that the company retains the remaining 76% of its profits. This suggests that the management is reinvesting most of the profits to grow the business.
Moreover, Dewhurst Group is determined to keep sharing its profits with shareholders which we infer from its long history of paying a dividend for at least ten years.
Summary
In total, it does look like Dewhurst Group has some positive aspects to its business. With a high rate of reinvestment, albeit at a low ROE, the company has managed to see a considerable growth in its earnings. While we won't completely dismiss the company, what we would do, is try to ascertain how risky the business is to make a more informed decision around the company. Our risks dashboard will have the 1 risk we have identified for Dewhurst Group.
Valuation is complex, but we're helping make it simple.
Find out whether Dewhurst Group is potentially over or undervalued by checking out our comprehensive analysis, which includes fair value estimates, risks and warnings, dividends, insider transactions and financial health.
View the Free AnalysisHave feedback on this article? Concerned about the content? Get in touch with us directly. Alternatively, email editorial-team (at) simplywallst.com.
This article by Simply Wall St is general in nature. We provide commentary based on historical data and analyst forecasts only using an unbiased methodology and our articles are not intended to be financial advice. It does not constitute a recommendation to buy or sell any stock, and does not take account of your objectives, or your financial situation. We aim to bring you long-term focused analysis driven by fundamental data. Note that our analysis may not factor in the latest price-sensitive company announcements or qualitative material. Simply Wall St has no position in any stocks mentioned.
About AIM:DWHT
Dewhurst Group
Manufactures and sells electrical components and control equipment for industrial and commercial capital goods in the United Kingdom, Europe, the Americas, Asia, Australia, and internationally.
Flawless balance sheet average dividend payer.
