Advertisement
Is Atos a Bargain After 103% Rally and Restructuring Headlines in 2025?

Simply Wall St
Reviewed by Bailey Pemberton
- Curious whether Atos is a hidden bargain, overpriced, or sitting right where it should be? Let’s break down what the recent numbers and headlines really say about the stock’s value.
- While Atos has soared 102.9% so far this year, short-term performance is decidedly mixed, with a 16.3% drop in the past month and a slight 2.0% gain over the past year.
- Recent buzz surrounds Atos as the company’s significant restructuring efforts and ongoing negotiations for asset sales have captured market attention. Headlines about shifts in leadership and deal talks have fueled speculation, adding both optimism and caution to recent price moves.
- Atos notches a 5 out of 6 valuation score. This hints that the market might be overlooking something. We’ll walk through the usual ways to assess fair value, but stick around for a more holistic approach to valuation near the end of the article.
Find out why Atos's 2.0% return over the last year is lagging behind its peers.
Approach 1: Atos Discounted Cash Flow (DCF) Analysis
The Discounted Cash Flow (DCF) model estimates a company's intrinsic value by projecting its future cash flows and discounting them back to today's value. This approach aims to calculate what Atos is truly worth based on its ability to generate cash in the years ahead.
Currently, Atos reports a Free Cash Flow (FCF) of -€213 million, representing a period of negative cash generation. Analyst forecasts expect a turnaround, projecting €104 million in FCF by 2028. Projections continue to increase, reaching over €1 billion by 2035. The first five years of cash flows are informed by analyst estimates, while future years rely on further extrapolations to capture long-term recovery and growth potential.
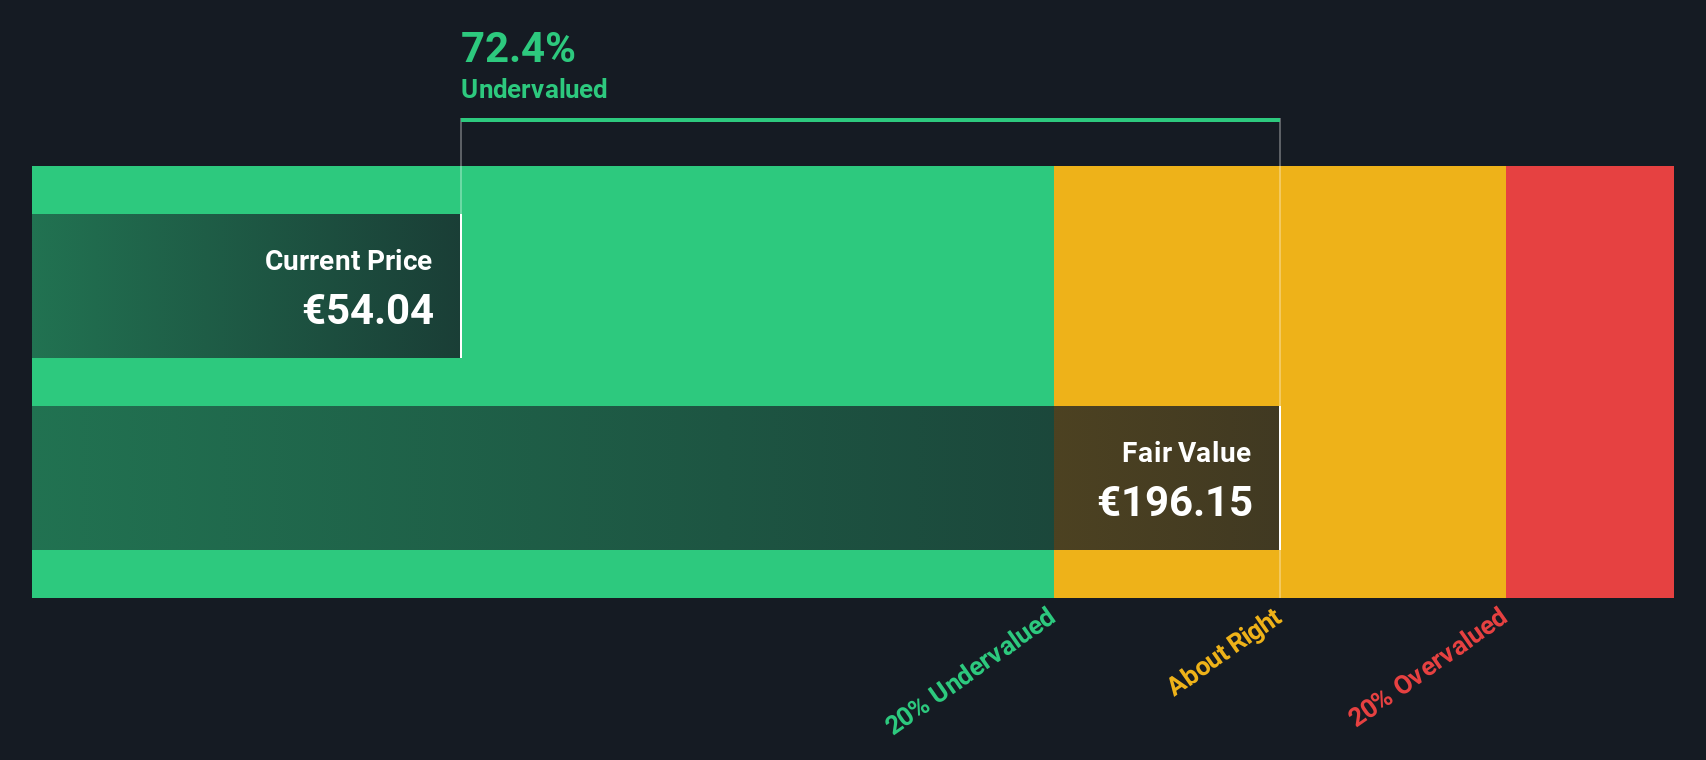
Based on these projections and applying standard discounting, the DCF model estimates an intrinsic value for Atos of €255.33 per share. This figure is 80.1% above the current share price, suggesting Atos may be deeply undervalued if these forecasts hold true.
Result: UNDERVALUED
Our Discounted Cash Flow (DCF) analysis suggests Atos is undervalued by 80.1%. Track this in your watchlist or portfolio, or discover 832 more undervalued stocks based on cash flows.
Approach 2: Atos Price vs Earnings
For profitable companies, the Price-to-Earnings (PE) ratio remains a popular and clear way to assess valuation. The PE ratio tells us how much investors are paying for each euro of earnings, which makes it particularly useful when comparing established businesses with consistent profit generation.
What constitutes a “normal” or “fair” PE ratio is influenced by several factors. Companies with higher growth expectations or lower risks usually attract higher PE multiples, while uncertainty or declining earnings pulls the ratio lower. It is also common to compare a company's PE with industry averages or close peers to provide a context for how the market sees its prospects.
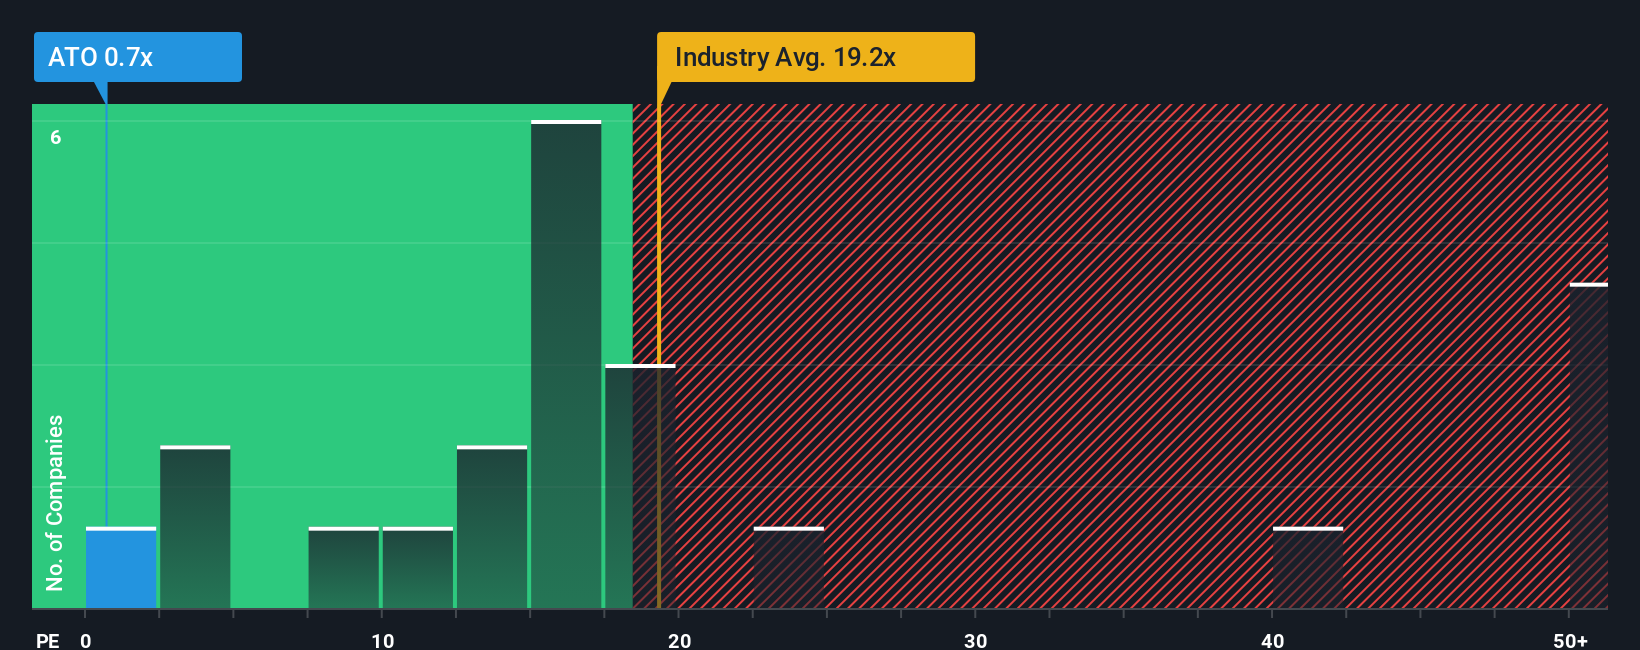
Atos is currently trading at a PE ratio of just 0.7x, a stark contrast to the IT industry average of 22.4x and its peer group average of 17.6x. This suggests that investors are pricing in significant risks or doubts around future profitability. However, Simply Wall St's “Fair Ratio” for Atos stands at 4.8x, a proprietary measure designed to reflect not just industry standards, but also the company’s unique risks, margins, growth outlook, and market value.
The Fair Ratio is a more precise benchmark than a peer or industry comparison because it tailors the expected multiple to Atos’s specific position, accounting for its future growth, risk profile, profitability, and size. This allows investors to see past superficial discounts or premiums and understand deeper value or risk factors baked into the stock price.
With Atos trading at 0.7x against a fair ratio of 4.8x, the market appears to have priced in much more negativity than warranted by the company's fundamentals. This gap signals that Atos is materially undervalued on a PE basis.
Result: UNDERVALUED
PE ratios tell one story, but what if the real opportunity lies elsewhere? Discover 1410 companies where insiders are betting big on explosive growth.
Upgrade Your Decision Making: Choose your Atos Narrative
Earlier we mentioned that there is an even better way to understand valuation, so let's introduce you to Narratives. A Narrative is simply a story you tell about Atos's future and its business drivers. It is your perspective on what will influence Atos’s revenue, profit margins, and ultimate fair value over time, grounded in real numbers and assumptions.
Narratives bridge the gap between a company’s story and its financial potential, letting you frame your thinking with forecasts and a specific fair value. They are designed to be intuitive and flexible, allowing anyone on Simply Wall St’s Community page to create, share, and update their views alongside millions of investors worldwide.
With Narratives, you can see how changing a few key beliefs about Atos, whether you expect faster restructuring, a jump in new customer wins, or persistent competition, impacts its fundamental value. Comparing your Narrative’s fair value to today’s price helps you make clear buy or sell decisions, and because Narratives update automatically as new information emerges, you'll always have a current, personalized outlook.
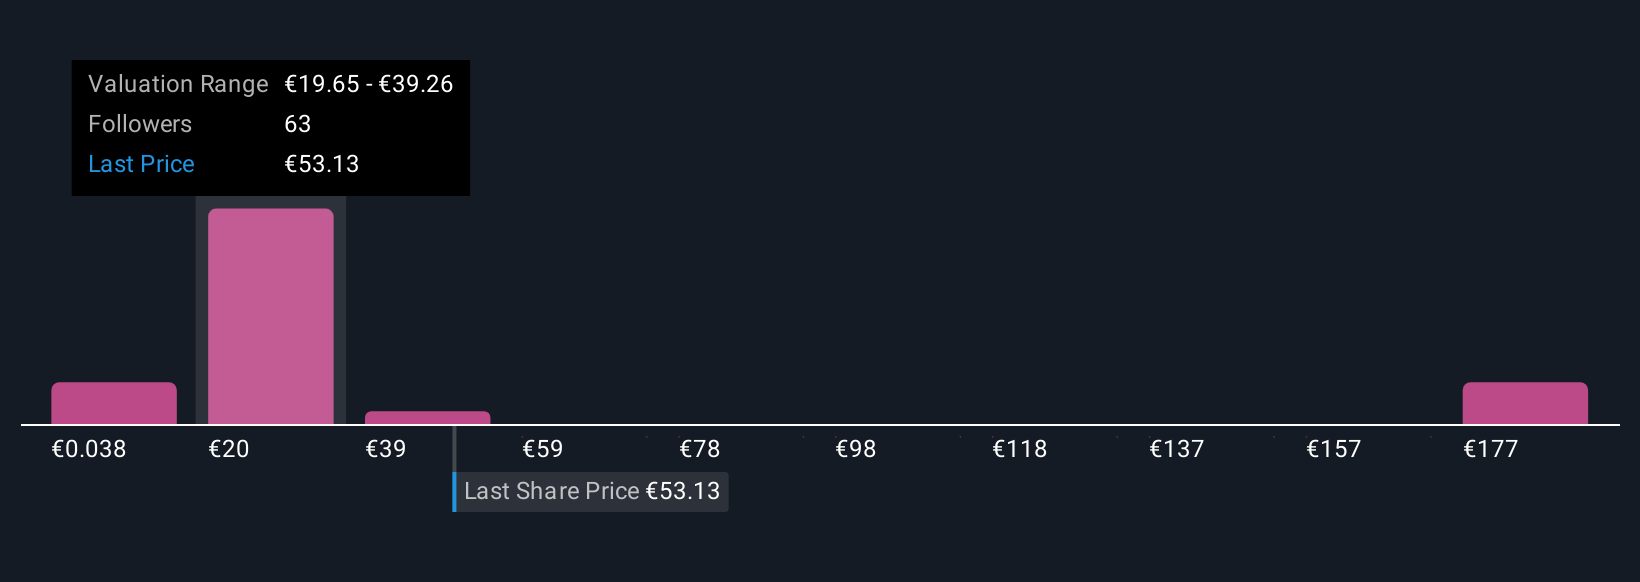
For example, some investors’ Narratives see Atos worth as little as €20.6 per share due to ongoing industry disruption and restructuring risk, while others anticipate successful turnaround efforts, supporting valuations as high as €41.0 per share.
Do you think there's more to the story for Atos? Head over to our Community to see what others are saying!
This article by Simply Wall St is general in nature. We provide commentary based on historical data and analyst forecasts only using an unbiased methodology and our articles are not intended to be financial advice. It does not constitute a recommendation to buy or sell any stock, and does not take account of your objectives, or your financial situation. We aim to bring you long-term focused analysis driven by fundamental data. Note that our analysis may not factor in the latest price-sensitive company announcements or qualitative material. Simply Wall St has no position in any stocks mentioned.
New: Manage All Your Stock Portfolios in One Place
We've created the ultimate portfolio companion for stock investors, and it's free.
• Connect an unlimited number of Portfolios and see your total in one currency
• Be alerted to new Warning Signs or Risks via email or mobile
• Track the Fair Value of your stocks
Have feedback on this article? Concerned about the content? Get in touch with us directly. Alternatively, email editorial-team@simplywallst.com
About ENXTPA:ATO
Atos
Provides digital transformation solutions and services in France and internationally.
Medium-low risk and undervalued.
Similar Companies
Market Insights

Advertisement
Community Narratives
The company that turned a verb into a global necessity and basically runs the modern internet, digital ads, smartphones, maps, and AI.
Fair Value US$300.00|6.3% undervalued
OS
Community Contributor
Flowers Foods Pays A Fair Price For Health
Fair Value US$16.12|26.0% undervalued
NV
Community Contributor
TMX Group will thrive with 33.3% profit margin and enduring market moat
Fair Value CA$49.90|3.7% overvalued
LI
Community Contributor