
Advertisement
Take Care Before Jumping Onto WALLIX GROUP SA (EPA:ALLIX) Even Though It's 27% Cheaper
WALLIX GROUP SA (EPA:ALLIX) shareholders won't be pleased to see that the share price has had a very rough month, dropping 27% and undoing the prior period's positive performance. Instead of being rewarded, shareholders who have already held through the last twelve months are now sitting on a 14% share price drop.
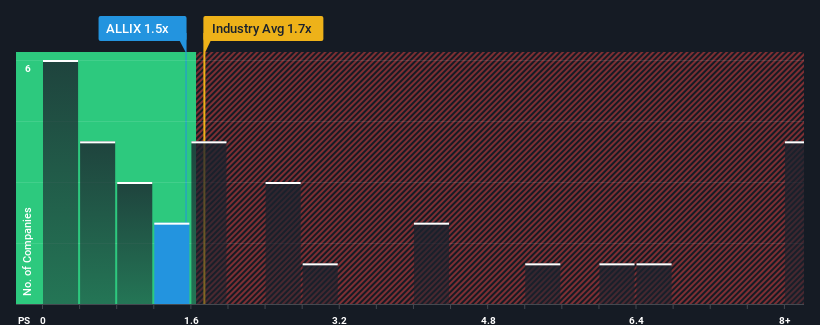
In spite of the heavy fall in price, it's still not a stretch to say that WALLIX GROUP's price-to-sales (or "P/S") ratio of 1.5x right now seems quite "middle-of-the-road" compared to the Software industry in France, where the median P/S ratio is around 1.7x. However, investors might be overlooking a clear opportunity or potential setback if there is no rational basis for the P/S.
Check out our latest analysis for WALLIX GROUP
How Has WALLIX GROUP Performed Recently?
WALLIX GROUP certainly has been doing a good job lately as it's been growing revenue more than most other companies. One possibility is that the P/S ratio is moderate because investors think this strong revenue performance might be about to tail off. If you like the company, you'd be hoping this isn't the case so that you could potentially pick up some stock while it's not quite in favour.
Keen to find out how analysts think WALLIX GROUP's future stacks up against the industry? In that case, our free report is a great place to start.What Are Revenue Growth Metrics Telling Us About The P/S?
There's an inherent assumption that a company should be matching the industry for P/S ratios like WALLIX GROUP's to be considered reasonable.
Retrospectively, the last year delivered an exceptional 21% gain to the company's top line. The latest three year period has also seen an excellent 47% overall rise in revenue, aided by its short-term performance. So we can start by confirming that the company has done a great job of growing revenue over that time.
Shifting to the future, estimates from the two analysts covering the company suggest revenue should grow by 23% per annum over the next three years. Meanwhile, the rest of the industry is forecast to only expand by 9.3% each year, which is noticeably less attractive.
With this in consideration, we find it intriguing that WALLIX GROUP's P/S is closely matching its industry peers. Apparently some shareholders are skeptical of the forecasts and have been accepting lower selling prices.
What We Can Learn From WALLIX GROUP's P/S?
Following WALLIX GROUP's share price tumble, its P/S is just clinging on to the industry median P/S. Using the price-to-sales ratio alone to determine if you should sell your stock isn't sensible, however it can be a practical guide to the company's future prospects.
We've established that WALLIX GROUP currently trades on a lower than expected P/S since its forecasted revenue growth is higher than the wider industry. Perhaps uncertainty in the revenue forecasts are what's keeping the P/S ratio consistent with the rest of the industry. However, if you agree with the analysts' forecasts, you may be able to pick up the stock at an attractive price.
Don't forget that there may be other risks. For instance, we've identified 3 warning signs for WALLIX GROUP that you should be aware of.
It's important to make sure you look for a great company, not just the first idea you come across. So if growing profitability aligns with your idea of a great company, take a peek at this free list of interesting companies with strong recent earnings growth (and a low P/E).
Valuation is complex, but we're here to simplify it.
Discover if WALLIX GROUP might be undervalued or overvalued with our detailed analysis, featuring fair value estimates, potential risks, dividends, insider trades, and its financial condition.
Access Free AnalysisHave feedback on this article? Concerned about the content? Get in touch with us directly. Alternatively, email editorial-team (at) simplywallst.com.
This article by Simply Wall St is general in nature. We provide commentary based on historical data and analyst forecasts only using an unbiased methodology and our articles are not intended to be financial advice. It does not constitute a recommendation to buy or sell any stock, and does not take account of your objectives, or your financial situation. We aim to bring you long-term focused analysis driven by fundamental data. Note that our analysis may not factor in the latest price-sensitive company announcements or qualitative material. Simply Wall St has no position in any stocks mentioned.
About ENXTPA:ALLIX
WALLIX GROUP
WALLIX GROUP SA publishes and provides cybersecurity software solutions worldwide.
High growth potential and good value.
Market Insights

Advertisement
Community Narratives
MicroVision will explode future revenue by 380.37% with a vision towards success
Fair Value US$60.00|98.4% undervalued
TH
Community Contributor
The Indispensable Artery for a New North American Economy
Fair Value CA$132.87|1.3% undervalued
TI
Community Contributor