Owning 50% in Virbac SA (EPA:VIRP) means that insiders are heavily invested in the company's future


Key Insights
- Significant insider control over Virbac implies vested interests in company growth
- 50% of the company is held by a single shareholder (Marie-Helene Dick-Madelpuech)
- Institutional ownership in Virbac is 24%
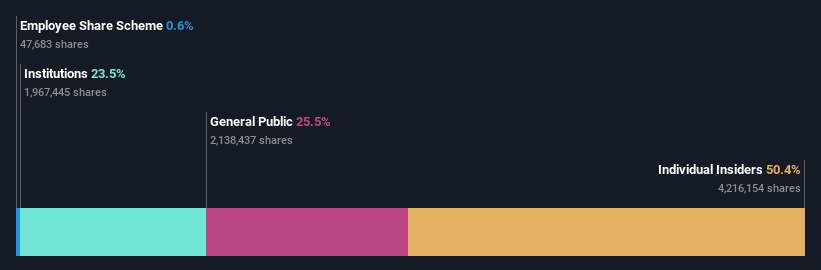
A look at the shareholders of Virbac SA (EPA:VIRP) can tell us which group is most powerful. The group holding the most number of shares in the company, around 50% to be precise, is individual insiders. That is, the group stands to benefit the most if the stock rises (or lose the most if there is a downturn).
So, insiders of Virbac have a lot at stake and every decision they make on the company’s future is important to them from a financial point of view.
In the chart below, we zoom in on the different ownership groups of Virbac.
Check out our latest analysis for Virbac
What Does The Institutional Ownership Tell Us About Virbac?
Many institutions measure their performance against an index that approximates the local market. So they usually pay more attention to companies that are included in major indices.
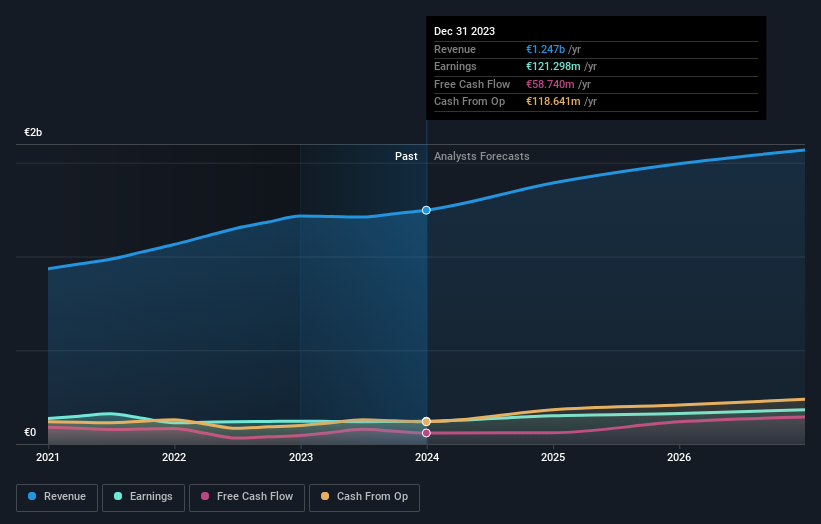
We can see that Virbac does have institutional investors; and they hold a good portion of the company's stock. This suggests some credibility amongst professional investors. But we can't rely on that fact alone since institutions make bad investments sometimes, just like everyone does. If multiple institutions change their view on a stock at the same time, you could see the share price drop fast. It's therefore worth looking at Virbac's earnings history below. Of course, the future is what really matters.
We note that hedge funds don't have a meaningful investment in Virbac. The company's largest shareholder is Marie-Helene Dick-Madelpuech, with ownership of 50%. With such a huge stake in the ownership, we infer that they have significant control of the future of the company. Meanwhile, the second and third largest shareholders, hold 1.9% and 1.8%, of the shares outstanding, respectively.
While it makes sense to study institutional ownership data for a company, it also makes sense to study analyst sentiments to know which way the wind is blowing. Quite a few analysts cover the stock, so you could look into forecast growth quite easily.
Insider Ownership Of Virbac
While the precise definition of an insider can be subjective, almost everyone considers board members to be insiders. Management ultimately answers to the board. However, it is not uncommon for managers to be executive board members, especially if they are a founder or the CEO.
Most consider insider ownership a positive because it can indicate the board is well aligned with other shareholders. However, on some occasions too much power is concentrated within this group.
Our information suggests that insiders own more than half of Virbac SA. This gives them effective control of the company. That means insiders have a very meaningful €1.5b stake in this €2.9b business. It is good to see this level of investment. You can check here to see if those insiders have been selling any of their shares.
General Public Ownership
With a 26% ownership, the general public, mostly comprising of individual investors, have some degree of sway over Virbac. While this group can't necessarily call the shots, it can certainly have a real influence on how the company is run.
Next Steps:
I find it very interesting to look at who exactly owns a company. But to truly gain insight, we need to consider other information, too.
I like to dive deeper into how a company has performed in the past. You can access this interactive graph of past earnings, revenue and cash flow, for free.
If you are like me, you may want to think about whether this company will grow or shrink. Luckily, you can check this free report showing analyst forecasts for its future.
NB: Figures in this article are calculated using data from the last twelve months, which refer to the 12-month period ending on the last date of the month the financial statement is dated. This may not be consistent with full year annual report figures.
New: Manage All Your Stock Portfolios in One Place
We've created the ultimate portfolio companion for stock investors, and it's free.
• Connect an unlimited number of Portfolios and see your total in one currency
• Be alerted to new Warning Signs or Risks via email or mobile
• Track the Fair Value of your stocks
Have feedback on this article? Concerned about the content? Get in touch with us directly. Alternatively, email editorial-team (at) simplywallst.com.
This article by Simply Wall St is general in nature. We provide commentary based on historical data and analyst forecasts only using an unbiased methodology and our articles are not intended to be financial advice. It does not constitute a recommendation to buy or sell any stock, and does not take account of your objectives, or your financial situation. We aim to bring you long-term focused analysis driven by fundamental data. Note that our analysis may not factor in the latest price-sensitive company announcements or qualitative material. Simply Wall St has no position in any stocks mentioned.
Have feedback on this article? Concerned about the content? Get in touch with us directly. Alternatively, email editorial-team@simplywallst.com
About ENXTPA:VIRP
Virbac
Manufactures and sells a range of products and services for companion animals and farm animals in France, Europe, Latin America, North America, Asia, Pacific, and Africa and the Middle East.
Flawless balance sheet with solid track record.

