
Advertisement
Euroapi S.A. (EPA:EAPI) Stock Catapults 29% Though Its Price And Business Still Lag The Industry
Those holding Euroapi S.A. (EPA:EAPI) shares would be relieved that the share price has rebounded 29% in the last thirty days, but it needs to keep going to repair the recent damage it has caused to investor portfolios. Still, the 30-day jump doesn't change the fact that longer term shareholders have seen their stock decimated by the 65% share price drop in the last twelve months.
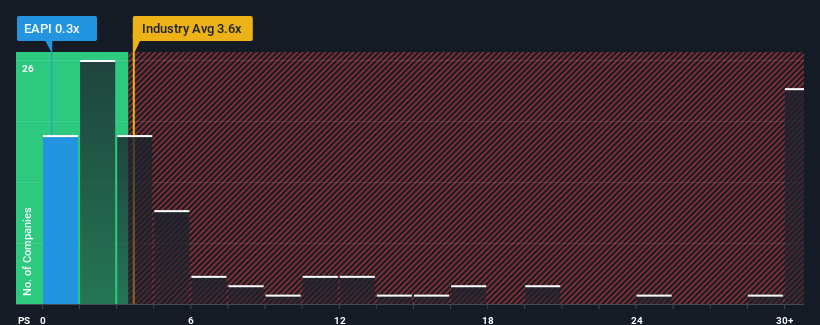
Even after such a large jump in price, considering about half the companies operating in France's Pharmaceuticals industry have price-to-sales ratios (or "P/S") above 2.4x, you may still consider Euroapi as an great investment opportunity with its 0.3x P/S ratio. Although, it's not wise to just take the P/S at face value as there may be an explanation why it's so limited.
See our latest analysis for Euroapi
What Does Euroapi's P/S Mean For Shareholders?
Recent times have been advantageous for Euroapi as its revenues have been rising faster than most other companies. One possibility is that the P/S ratio is low because investors think this strong revenue performance might be less impressive moving forward. If the company manages to stay the course, then investors should be rewarded with a share price that matches its revenue figures.
Keen to find out how analysts think Euroapi's future stacks up against the industry? In that case, our free report is a great place to start.Is There Any Revenue Growth Forecasted For Euroapi?
Euroapi's P/S ratio would be typical for a company that's expected to deliver very poor growth or even falling revenue, and importantly, perform much worse than the industry.
Retrospectively, the last year delivered a decent 3.9% gain to the company's revenues. The latest three year period has also seen a 7.9% overall rise in revenue, aided somewhat by its short-term performance. Accordingly, shareholders would have probably been satisfied with the medium-term rates of revenue growth.
Looking ahead now, revenue is anticipated to slump, contracting by 2.2% per annum during the coming three years according to the four analysts following the company. Meanwhile, the broader industry is forecast to expand by 5.0% per year, which paints a poor picture.
With this in consideration, we find it intriguing that Euroapi's P/S is closely matching its industry peers. Nonetheless, there's no guarantee the P/S has reached a floor yet with revenue going in reverse. There's potential for the P/S to fall to even lower levels if the company doesn't improve its top-line growth.
What We Can Learn From Euroapi's P/S?
Euroapi's recent share price jump still sees fails to bring its P/S alongside the industry median. Using the price-to-sales ratio alone to determine if you should sell your stock isn't sensible, however it can be a practical guide to the company's future prospects.
With revenue forecasts that are inferior to the rest of the industry, it's no surprise that Euroapi's P/S is on the lower end of the spectrum. Right now shareholders are accepting the low P/S as they concede future revenue probably won't provide any pleasant surprises. It's hard to see the share price rising strongly in the near future under these circumstances.
Before you take the next step, you should know about the 2 warning signs for Euroapi (1 makes us a bit uncomfortable!) that we have uncovered.
If companies with solid past earnings growth is up your alley, you may wish to see this free collection of other companies with strong earnings growth and low P/E ratios.
Valuation is complex, but we're here to simplify it.
Discover if Euroapi might be undervalued or overvalued with our detailed analysis, featuring fair value estimates, potential risks, dividends, insider trades, and its financial condition.
Access Free AnalysisHave feedback on this article? Concerned about the content? Get in touch with us directly. Alternatively, email editorial-team (at) simplywallst.com.
This article by Simply Wall St is general in nature. We provide commentary based on historical data and analyst forecasts only using an unbiased methodology and our articles are not intended to be financial advice. It does not constitute a recommendation to buy or sell any stock, and does not take account of your objectives, or your financial situation. We aim to bring you long-term focused analysis driven by fundamental data. Note that our analysis may not factor in the latest price-sensitive company announcements or qualitative material. Simply Wall St has no position in any stocks mentioned.
About ENXTPA:EAPI
Euroapi
Develops, manufactures, markets, and distributes active pharmaceutical ingredients and intermediates used in the formulation of medicines for human and veterinary use in France, Europe, Rest of Europe, North America, the Asia Pacific, and internationally.
Adequate balance sheet and fair value.
Similar Companies
Market Insights

Advertisement
Community Narratives
MicroVision will explode future revenue by 380.37% with a vision towards success
Fair Value US$60.00|98.4% undervalued
TH
Community Contributor
The Indispensable Artery for a New North American Economy
Fair Value CA$132.87|1.3% undervalued
TI
Community Contributor