Stock Analysis
TFF Group (EPA:TFF) sheds 6.2% this week, as yearly returns fall more in line with earnings growth


One simple way to benefit from the stock market is to buy an index fund. But if you buy good businesses at attractive prices, your portfolio returns could exceed the average market return. For example, the TFF Group (EPA:TFF) share price is up 46% in the last three years, clearly besting the market return of around 18% (not including dividends). On the other hand, the returns haven't been quite so good recently, with shareholders up just 5.4% , including dividends .
While the stock has fallen 6.2% this week, it's worth focusing on the longer term and seeing if the stocks historical returns have been driven by the underlying fundamentals.
Check out our latest analysis for TFF Group
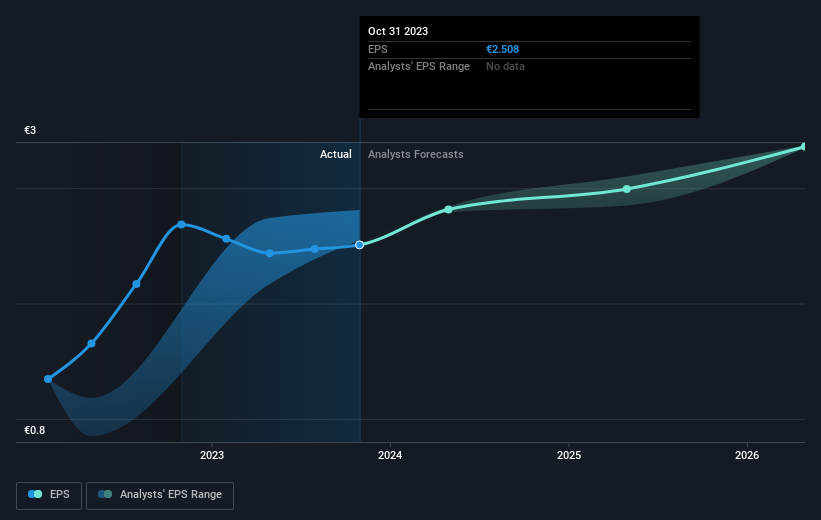
In his essay The Superinvestors of Graham-and-Doddsville Warren Buffett described how share prices do not always rationally reflect the value of a business. By comparing earnings per share (EPS) and share price changes over time, we can get a feel for how investor attitudes to a company have morphed over time.
During three years of share price growth, TFF Group achieved compound earnings per share growth of 38% per year. This EPS growth is higher than the 13% average annual increase in the share price. Therefore, it seems the market has moderated its expectations for growth, somewhat.
You can see below how EPS has changed over time (discover the exact values by clicking on the image).
We know that TFF Group has improved its bottom line over the last three years, but what does the future have in store? It might be well worthwhile taking a look at our free report on how its financial position has changed over time.
What About Dividends?
It is important to consider the total shareholder return, as well as the share price return, for any given stock. Whereas the share price return only reflects the change in the share price, the TSR includes the value of dividends (assuming they were reinvested) and the benefit of any discounted capital raising or spin-off. So for companies that pay a generous dividend, the TSR is often a lot higher than the share price return. In the case of TFF Group, it has a TSR of 52% for the last 3 years. That exceeds its share price return that we previously mentioned. The dividends paid by the company have thusly boosted the total shareholder return.
A Different Perspective
TFF Group's TSR for the year was broadly in line with the market average, at 5.4%. Most would be happy with a gain, and it helps that the year's return is actually better than the average return over five years, which was 2%. It is possible that management foresight will bring growth well into the future, even if the share price slows down. It's always interesting to track share price performance over the longer term. But to understand TFF Group better, we need to consider many other factors. Even so, be aware that TFF Group is showing 1 warning sign in our investment analysis , you should know about...
But note: TFF Group may not be the best stock to buy. So take a peek at this free list of interesting companies with past earnings growth (and further growth forecast).
Please note, the market returns quoted in this article reflect the market weighted average returns of stocks that currently trade on French exchanges.
Valuation is complex, but we're helping make it simple.
Find out whether TFF Group is potentially over or undervalued by checking out our comprehensive analysis, which includes fair value estimates, risks and warnings, dividends, insider transactions and financial health.
View the Free AnalysisHave feedback on this article? Concerned about the content? Get in touch with us directly. Alternatively, email editorial-team (at) simplywallst.com.
This article by Simply Wall St is general in nature. We provide commentary based on historical data and analyst forecasts only using an unbiased methodology and our articles are not intended to be financial advice. It does not constitute a recommendation to buy or sell any stock, and does not take account of your objectives, or your financial situation. We aim to bring you long-term focused analysis driven by fundamental data. Note that our analysis may not factor in the latest price-sensitive company announcements or qualitative material. Simply Wall St has no position in any stocks mentioned.
About ENXTPA:TFF
TFF Group
TFF Group, together with its subsidiaries, manufactures and distributes barrels and wood products for the aging of wines and alcohols in France, rest of Europe, the United States, Asia, and internationally.
Moderate growth potential with mediocre balance sheet.
