
Advertisement
The external fund manager backed by Berkshire Hathaway's Charlie Munger, Li Lu, makes no bones about it when he says 'The biggest investment risk is not the volatility of prices, but whether you will suffer a permanent loss of capital.' When we think about how risky a company is, we always like to look at its use of debt, since debt overload can lead to ruin. Importantly, SpineGuard SA (EPA:ALSGD) does carry debt. But should shareholders be worried about its use of debt?
When Is Debt A Problem?
Debt assists a business until the business has trouble paying it off, either with new capital or with free cash flow. If things get really bad, the lenders can take control of the business. However, a more usual (but still expensive) situation is where a company must dilute shareholders at a cheap share price simply to get debt under control. Having said that, the most common situation is where a company manages its debt reasonably well - and to its own advantage. The first step when considering a company's debt levels is to consider its cash and debt together.
See our latest analysis for SpineGuard
What Is SpineGuard's Net Debt?
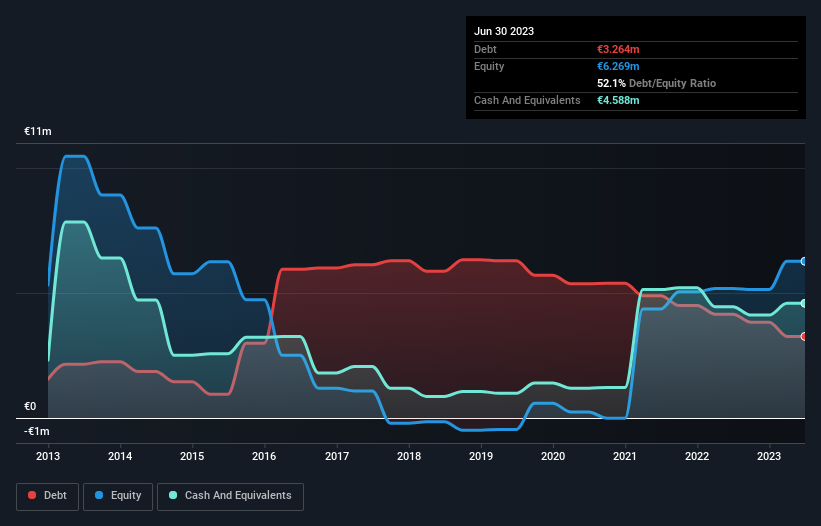
The image below, which you can click on for greater detail, shows that SpineGuard had debt of €3.26m at the end of June 2023, a reduction from €4.15m over a year. But it also has €4.59m in cash to offset that, meaning it has €1.32m net cash.
How Healthy Is SpineGuard's Balance Sheet?
According to the last reported balance sheet, SpineGuard had liabilities of €3.49m due within 12 months, and liabilities of €2.36m due beyond 12 months. Offsetting these obligations, it had cash of €4.59m as well as receivables valued at €1.34m due within 12 months. So these liquid assets roughly match the total liabilities.
Having regard to SpineGuard's size, it seems that its liquid assets are well balanced with its total liabilities. So while it's hard to imagine that the €11.3m company is struggling for cash, we still think it's worth monitoring its balance sheet. Simply put, the fact that SpineGuard has more cash than debt is arguably a good indication that it can manage its debt safely. There's no doubt that we learn most about debt from the balance sheet. But you can't view debt in total isolation; since SpineGuard will need earnings to service that debt. So if you're keen to discover more about its earnings, it might be worth checking out this graph of its long term earnings trend.
Over 12 months, SpineGuard reported revenue of €5.3m, which is a gain of 12%, although it did not report any earnings before interest and tax. We usually like to see faster growth from unprofitable companies, but each to their own.
So How Risky Is SpineGuard?
We have no doubt that loss making companies are, in general, riskier than profitable ones. And in the last year SpineGuard had an earnings before interest and tax (EBIT) loss, truth be told. And over the same period it saw negative free cash outflow of €4.1m and booked a €3.2m accounting loss. Given it only has net cash of €1.32m, the company may need to raise more capital if it doesn't reach break-even soon. Overall, its balance sheet doesn't seem overly risky, at the moment, but we're always cautious until we see the positive free cash flow. There's no doubt that we learn most about debt from the balance sheet. However, not all investment risk resides within the balance sheet - far from it. We've identified 5 warning signs with SpineGuard (at least 3 which are potentially serious) , and understanding them should be part of your investment process.
At the end of the day, it's often better to focus on companies that are free from net debt. You can access our special list of such companies (all with a track record of profit growth). It's free.
New: Manage All Your Stock Portfolios in One Place
We've created the ultimate portfolio companion for stock investors, and it's free.
• Connect an unlimited number of Portfolios and see your total in one currency
• Be alerted to new Warning Signs or Risks via email or mobile
• Track the Fair Value of your stocks
Have feedback on this article? Concerned about the content? Get in touch with us directly. Alternatively, email editorial-team (at) simplywallst.com.
This article by Simply Wall St is general in nature. We provide commentary based on historical data and analyst forecasts only using an unbiased methodology and our articles are not intended to be financial advice. It does not constitute a recommendation to buy or sell any stock, and does not take account of your objectives, or your financial situation. We aim to bring you long-term focused analysis driven by fundamental data. Note that our analysis may not factor in the latest price-sensitive company announcements or qualitative material. Simply Wall St has no position in any stocks mentioned.
About ENXTPA:ALSGD
SpineGuard
Provides designs, develops, and markets medical devices for spine in France and internationally.
Medium-low risk with adequate balance sheet.
Market Insights

Advertisement
Community Narratives
MicroVision will explode future revenue by 380.37% with a vision towards success
Fair Value US$60.00|98.4% undervalued
TH
Community Contributor
The Indispensable Artery for a New North American Economy
Fair Value CA$132.87|1.3% undervalued
TI
Community Contributor