
Advertisement
The Market Lifts S.T. Dupont S.A. (EPA:DPT) Shares 25% But It Can Do More
S.T. Dupont S.A. (EPA:DPT) shareholders have had their patience rewarded with a 25% share price jump in the last month. Not all shareholders will be feeling jubilant, since the share price is still down a very disappointing 26% in the last twelve months.
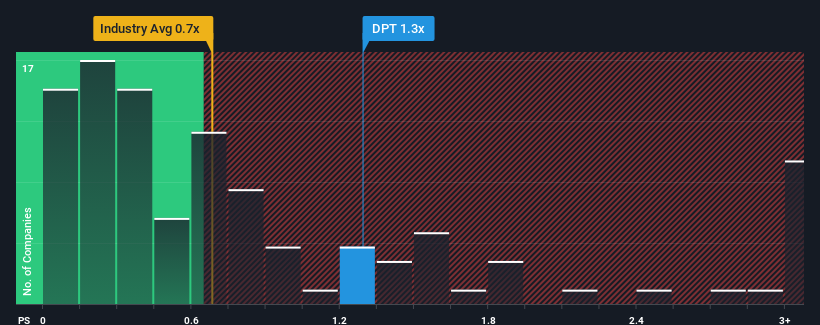
In spite of the firm bounce in price, you could still be forgiven for feeling indifferent about S.T. Dupont's P/S ratio of 1.3x, since the median price-to-sales (or "P/S") ratio for the Luxury industry in France is about the same. However, investors might be overlooking a clear opportunity or potential setback if there is no rational basis for the P/S.
Check out our latest analysis for S.T. Dupont
How Has S.T. Dupont Performed Recently?
S.T. Dupont has been doing a good job lately as it's been growing revenue at a solid pace. One possibility is that the P/S is moderate because investors think this respectable revenue growth might not be enough to outperform the broader industry in the near future. Those who are bullish on S.T. Dupont will be hoping that this isn't the case, so that they can pick up the stock at a lower valuation.
Although there are no analyst estimates available for S.T. Dupont, take a look at this free data-rich visualisation to see how the company stacks up on earnings, revenue and cash flow.How Is S.T. Dupont's Revenue Growth Trending?
In order to justify its P/S ratio, S.T. Dupont would need to produce growth that's similar to the industry.
Retrospectively, the last year delivered an exceptional 18% gain to the company's top line. The strong recent performance means it was also able to grow revenue by 69% in total over the last three years. Accordingly, shareholders would have definitely welcomed those medium-term rates of revenue growth.
Comparing that recent medium-term revenue trajectory with the industry's one-year growth forecast of 5.8% shows it's noticeably more attractive.
With this information, we find it interesting that S.T. Dupont is trading at a fairly similar P/S compared to the industry. Apparently some shareholders believe the recent performance is at its limits and have been accepting lower selling prices.
What We Can Learn From S.T. Dupont's P/S?
S.T. Dupont's stock has a lot of momentum behind it lately, which has brought its P/S level with the rest of the industry. It's argued the price-to-sales ratio is an inferior measure of value within certain industries, but it can be a powerful business sentiment indicator.
We've established that S.T. Dupont currently trades on a lower than expected P/S since its recent three-year growth is higher than the wider industry forecast. It'd be fair to assume that potential risks the company faces could be the contributing factor to the lower than expected P/S. While recent revenue trends over the past medium-term suggest that the risk of a price decline is low, investors appear to see the likelihood of revenue fluctuations in the future.
Having said that, be aware S.T. Dupont is showing 2 warning signs in our investment analysis, and 1 of those is a bit concerning.
If strong companies turning a profit tickle your fancy, then you'll want to check out this free list of interesting companies that trade on a low P/E (but have proven they can grow earnings).
New: Manage All Your Stock Portfolios in One Place
We've created the ultimate portfolio companion for stock investors, and it's free.
• Connect an unlimited number of Portfolios and see your total in one currency
• Be alerted to new Warning Signs or Risks via email or mobile
• Track the Fair Value of your stocks
Have feedback on this article? Concerned about the content? Get in touch with us directly. Alternatively, email editorial-team (at) simplywallst.com.
This article by Simply Wall St is general in nature. We provide commentary based on historical data and analyst forecasts only using an unbiased methodology and our articles are not intended to be financial advice. It does not constitute a recommendation to buy or sell any stock, and does not take account of your objectives, or your financial situation. We aim to bring you long-term focused analysis driven by fundamental data. Note that our analysis may not factor in the latest price-sensitive company announcements or qualitative material. Simply Wall St has no position in any stocks mentioned.
About ENXTPA:DPT
S.T. Dupont
Designs, manufactures, and sells luxury products in France and internationally.
Flawless balance sheet with acceptable track record.
Market Insights

Advertisement
Community Narratives
MicroVision will explode future revenue by 380.37% with a vision towards success
Fair Value US$60.00|98.4% undervalued
TH
Community Contributor
The Indispensable Artery for a New North American Economy
Fair Value CA$132.87|1.3% undervalued
TI
Community Contributor