Advertisement
- France
- /
- Electrical
- /
- ENXTPA:SU
What Recent Partnerships Mean for Schneider Electric’s Value Amid a 6.6% Share Price Dip

Simply Wall St
Reviewed by Bailey Pemberton
- Thinking about whether Schneider Electric is a good buy right now? Let’s cut through the hype and dive into what might really drive its value.
- The stock has cooled off recently, falling 6.6% over the past week and down 4.2% in the last month. It is still up an impressive 121.0% over five years.
- This latest dip appears to have followed sector-wide volatility and renewed investor focus on industrial automation. Major headlines also highlight the company's recent strategic partnerships and sustainability initiatives, sparking discussions about where the next big move could come from.
- On our valuation checks, Schneider Electric scores just 1 out of 6 for being undervalued. We will walk through what’s behind that assessment and later explore if there is a smarter way to look at valuation beyond just these numbers.
Schneider Electric scores just 1/6 on our valuation checks. See what other red flags we found in the full valuation breakdown.
Approach 1: Schneider Electric Discounted Cash Flow (DCF) Analysis
The Discounted Cash Flow (DCF) model estimates the value of Schneider Electric by projecting its future cash flows and then discounting those sums back to their value today. Essentially, it attempts to figure out what the business is worth if you had all expected future cash right now.
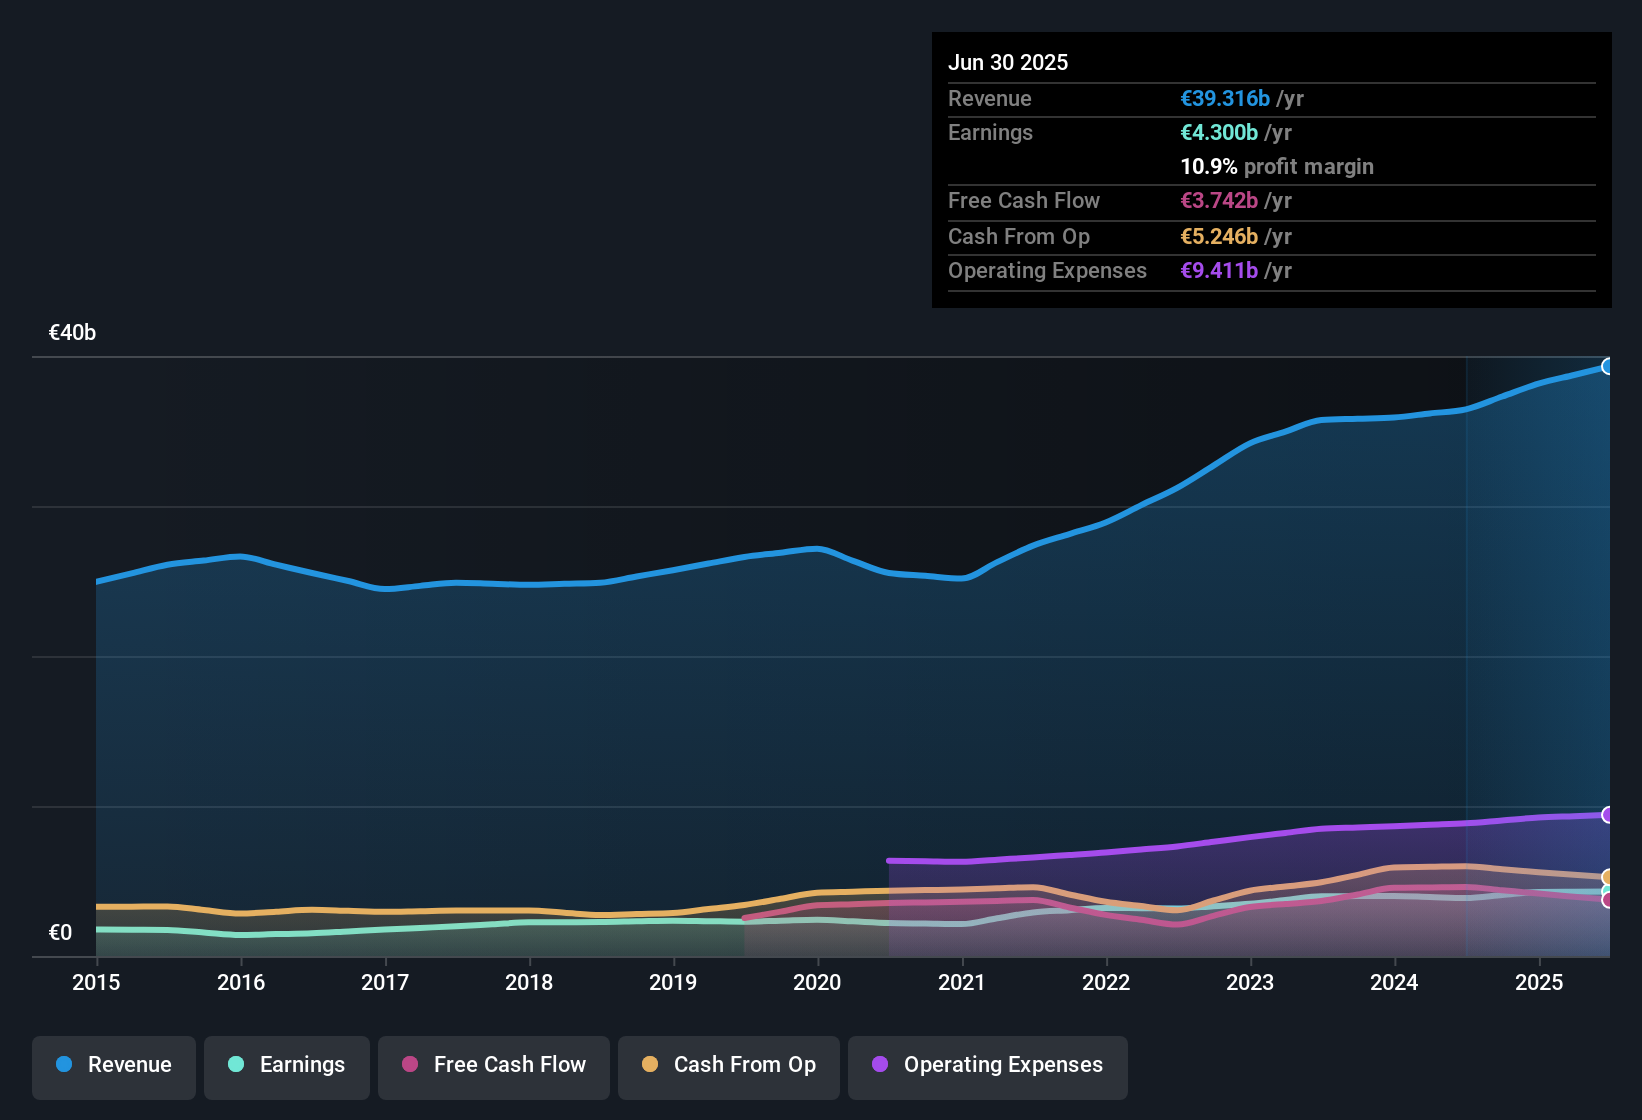
For 2023, Schneider Electric generated free cash flow of approximately €3.79 billion. According to analyst projections, this figure is expected to gradually increase, reaching roughly €5.84 billion by 2029. Notably, analysts only provide formal estimates for the next five years. Beyond that, Simply Wall St extrapolates future figures and projects that free cash flows could rise to about €6.65 billion by 2035.
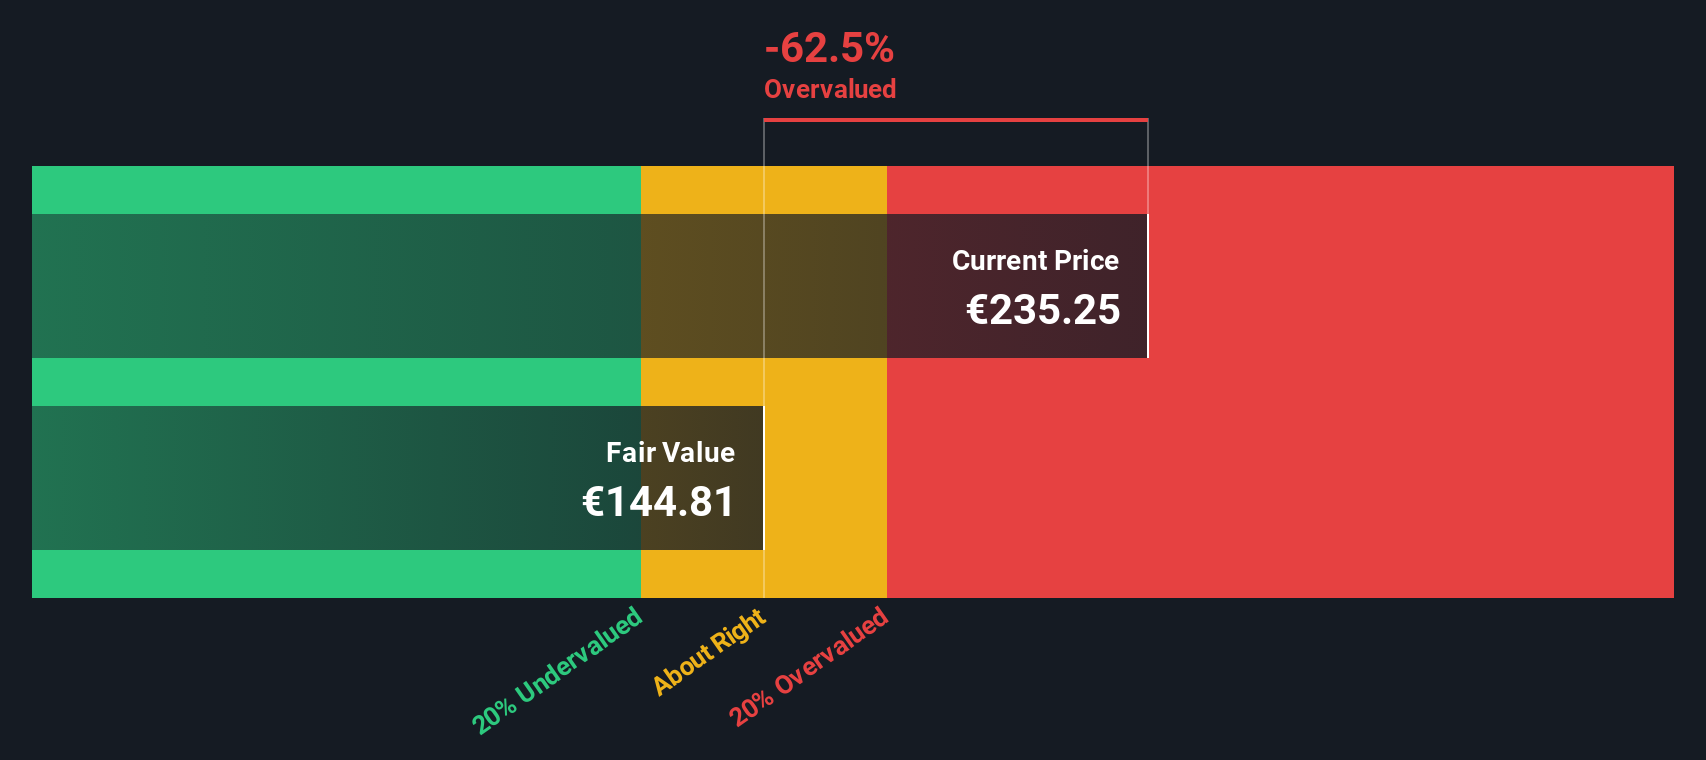
Based on these forecasts and after discounting future cash flows, the DCF analysis estimates that Schneider Electric’s intrinsic fair value is €142.56 per share. However, the current share price stands about 67.8% above this estimate. This signals that the stock is significantly overvalued according to DCF calculations.
Result: OVERVALUED
Our Discounted Cash Flow (DCF) analysis suggests Schneider Electric may be overvalued by 67.8%. Discover 841 undervalued stocks or create your own screener to find better value opportunities.
Approach 2: Schneider Electric Price vs Earnings
The Price-to-Earnings (PE) ratio is a time-tested way to value profitable companies, offering a straightforward snapshot of how much investors are willing to pay for each euro of earnings. For businesses with consistent profits like Schneider Electric, the PE ratio lets us compare valuation levels across different companies and industries quickly.
But a company’s “fair” PE isn’t set in stone. Investors tend to pay higher PE ratios for companies with stronger growth prospects, lower risk profiles, or industry leadership. By contrast, uncertain outlooks or sector headwinds can pull a PE lower and signal a bargain is not as good as it seems.
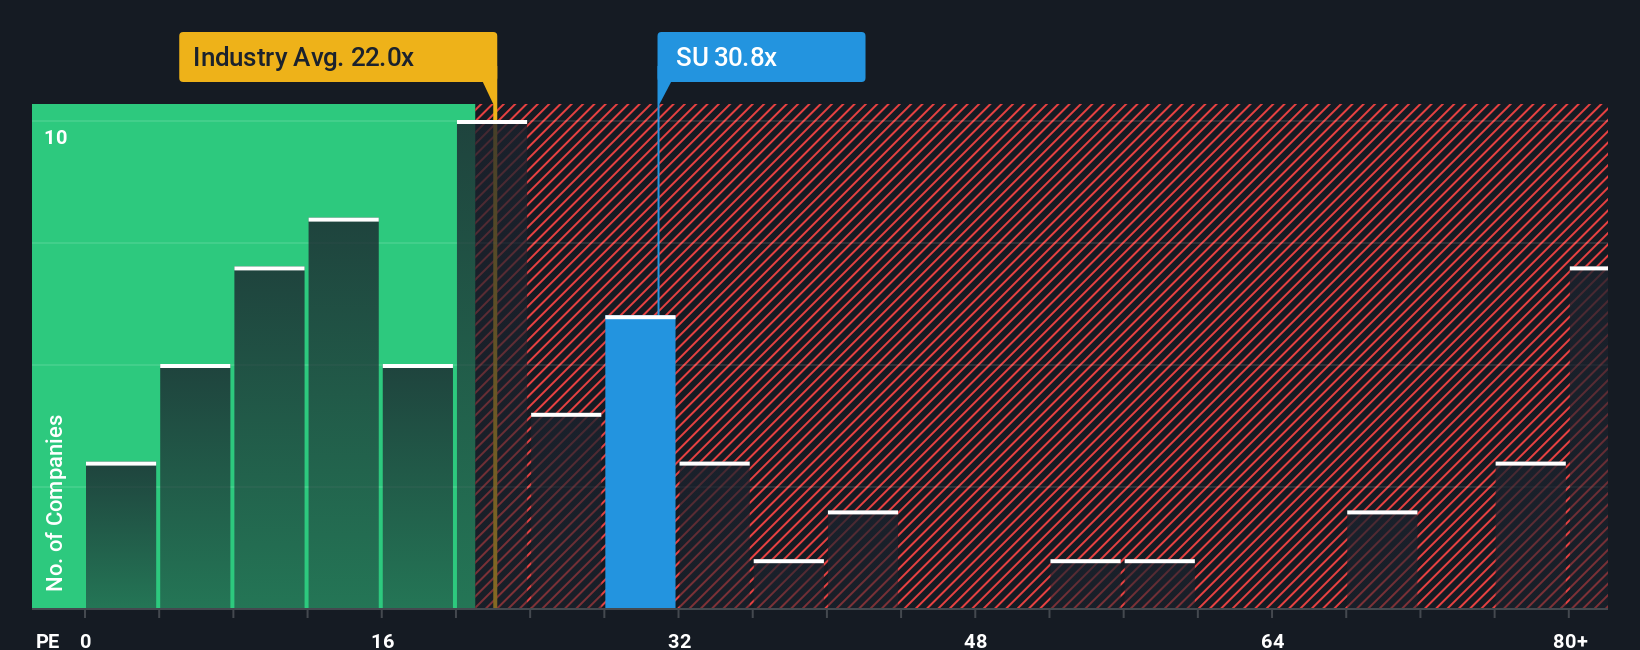
Schneider Electric currently trades at a PE of 31.3x. That puts it just above the electrical industry average of 30.9x and notably ahead of its peer group average, which stands at 26.4x. However, while peer and industry comparisons are helpful, they do not account for the specific nuances of Schneider Electric’s growth trajectory, profit margins, and risk exposure.
This is where Simply Wall St’s “Fair Ratio” comes in. The Fair Ratio combines all those essential factors such as growth forecasts, profit margins, the risk environment, market capitalization, and more to estimate what a justified PE ratio should be. For Schneider Electric, the Fair Ratio is 34.3x, a little higher than its actual PE. Since the gap between the Fair Ratio and current PE is relatively small, it suggests Schneider Electric’s shares are about fairly valued by this measure.
Result: ABOUT RIGHT
PE ratios tell one story, but what if the real opportunity lies elsewhere? Discover 1411 companies where insiders are betting big on explosive growth.
Upgrade Your Decision Making: Choose your Schneider Electric Narrative
Earlier we mentioned that there is an even better way to understand valuation. Let’s introduce you to Narratives. A Narrative is a clear and accessible way for you to tell your story about Schneider Electric’s future, connecting your perspective on its opportunities, risks, and strategy with your own assumptions about revenue, earnings, and margins. Narratives bridge a company’s big-picture story to a concrete financial forecast and ultimately to what you believe is a fair value.
On Simply Wall St’s Community page, Narratives are used by millions of investors to quickly share, compare, and update their reasoning alongside the numbers. This makes your investment decision-making smarter and more dynamic. Narratives clearly show when your view (Fair Value) suggests the stock is a buy or a sell compared to the current Price, and they automatically adjust as new news or earnings reports are published.
For instance, with Schneider Electric, optimistic investors focused on its digital services growth have set higher fair values, as much as €289.0 per share. More cautious users who expect current industry risks to weigh on profits assign fair values as low as €220.0. This demonstrates how Narratives reflect a range of informed, evolving perspectives in real time.
Do you think there's more to the story for Schneider Electric? Head over to our Community to see what others are saying!
This article by Simply Wall St is general in nature. We provide commentary based on historical data and analyst forecasts only using an unbiased methodology and our articles are not intended to be financial advice. It does not constitute a recommendation to buy or sell any stock, and does not take account of your objectives, or your financial situation. We aim to bring you long-term focused analysis driven by fundamental data. Note that our analysis may not factor in the latest price-sensitive company announcements or qualitative material. Simply Wall St has no position in any stocks mentioned.
New: Manage All Your Stock Portfolios in One Place
We've created the ultimate portfolio companion for stock investors, and it's free.
• Connect an unlimited number of Portfolios and see your total in one currency
• Be alerted to new Warning Signs or Risks via email or mobile
• Track the Fair Value of your stocks
Have feedback on this article? Concerned about the content? Get in touch with us directly. Alternatively, email editorial-team@simplywallst.com
About ENXTPA:SU
Schneider Electric
Engages in the energy management and industrial automation businesses worldwide.
Proven track record with adequate balance sheet and pays a dividend.
Similar Companies
Market Insights

Advertisement
Community Narratives
The company that turned a verb into a global necessity and basically runs the modern internet, digital ads, smartphones, maps, and AI.
Fair Value US$300.00|7.5% undervalued
OS
Community Contributor
Flowers Foods Pays A Fair Price For Health
Fair Value US$16.12|25.4% undervalued
NV
Community Contributor
TMX Group will thrive with 33.3% profit margin and enduring market moat
Fair Value CA$49.90|3.6% overvalued
LI
Community Contributor
The "Molecular Pencil": Why Beam's Technology is Built to Win
Fair Value US$65.01|65.0% undervalued
DA
Community Contributor