Advertisement
- France
- /
- Electrical
- /
- ENXTPA:SU
Is There Now an Opportunity in Schneider Electric After Expansion Into Digital Services?

Simply Wall St
Reviewed by Bailey Pemberton
- Ever wondered if Schneider Electric’s current share price is a bargain or just business as usual? Let’s dig into what is really driving the value of this global energy player.
- The stock has cooled off recently, with a 5.7% dip over the past week and a 9.8% slide in the last month. It still boasts an impressive 108.2% return over five years.
- This recent pullback comes amid broad sector shifts and renewed debate around electrification trends, as investors weigh ongoing sustainability initiatives and evolving EU energy policies. Headlines this month have highlighted Schneider’s expansion into digital services and a new push toward building automation, both of which could shape future demand.
- Schneider Electric currently scores 1 out of 6 on our valuation checks, suggesting it is undervalued in just one key area, but that is only part of the story. Stay with us as we break down different valuation methods, and keep an eye out for what might be a smarter approach to understanding Schneider’s true worth.
Schneider Electric scores just 1/6 on our valuation checks. See what other red flags we found in the full valuation breakdown.
Approach 1: Schneider Electric Discounted Cash Flow (DCF) Analysis
A Discounted Cash Flow (DCF) model estimates what a company is really worth by projecting its future cash flows and then discounting those projections back to their present value. This method helps investors see beyond short-term price swings by focusing on the company’s underlying potential to generate cash over time.
For Schneider Electric, the latest reported Free Cash Flow stands at approximately €3.79 billion. Analyst forecasts suggest this number could rise, with Simply Wall St estimating Free Cash Flow to reach €5.84 billion by 2029. Beyond that, projections are extrapolated, carrying them out to ten years with moderate growth assumptions.
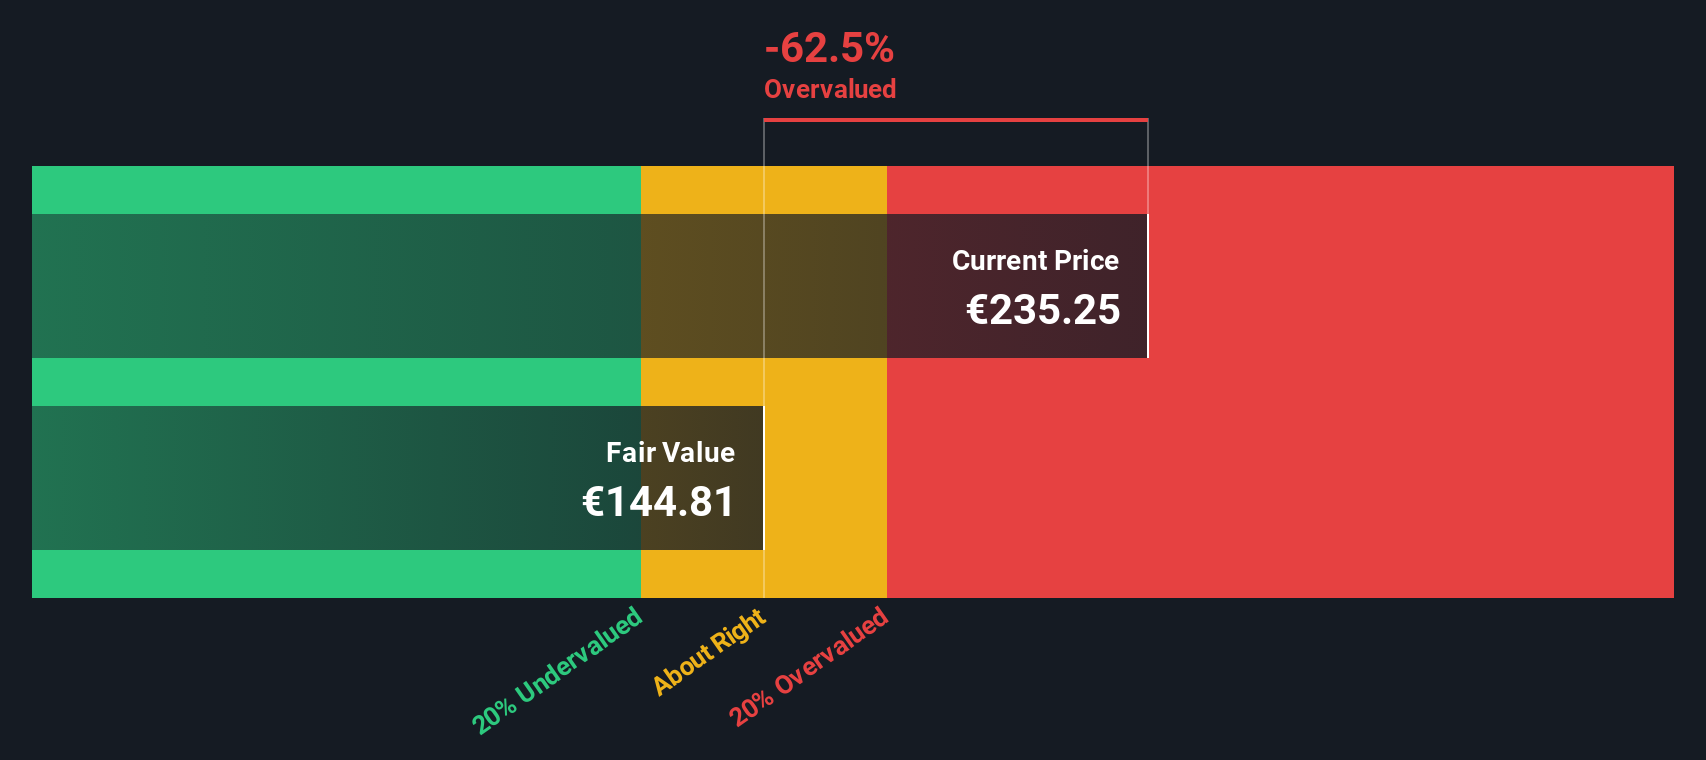
Using these figures and the 2 Stage Free Cash Flow to Equity model, the DCF calculation points to an estimated intrinsic value of €145.12 per share. However, when compared to the market price, this implies the stock is currently about 53.2% overvalued. This suggests that buyers today are paying a considerable premium relative to projected future returns.
Result: OVERVALUED
Our Discounted Cash Flow (DCF) analysis suggests Schneider Electric may be overvalued by 53.2%. Discover 918 undervalued stocks or create your own screener to find better value opportunities.
Approach 2: Schneider Electric Price vs Earnings
Price-to-Earnings (PE) is considered one of the best valuation tools for established, profitable companies like Schneider Electric. It helps investors gauge how much they are paying for each euro of current earnings, providing a straightforward way to compare stocks across similar profit levels.
A company's "normal" or fair PE ratio can vary depending on its growth prospects and perceived risk. Higher expected growth or lower risk often justify a higher PE, while slower growth or greater uncertainty may pull this ratio down.
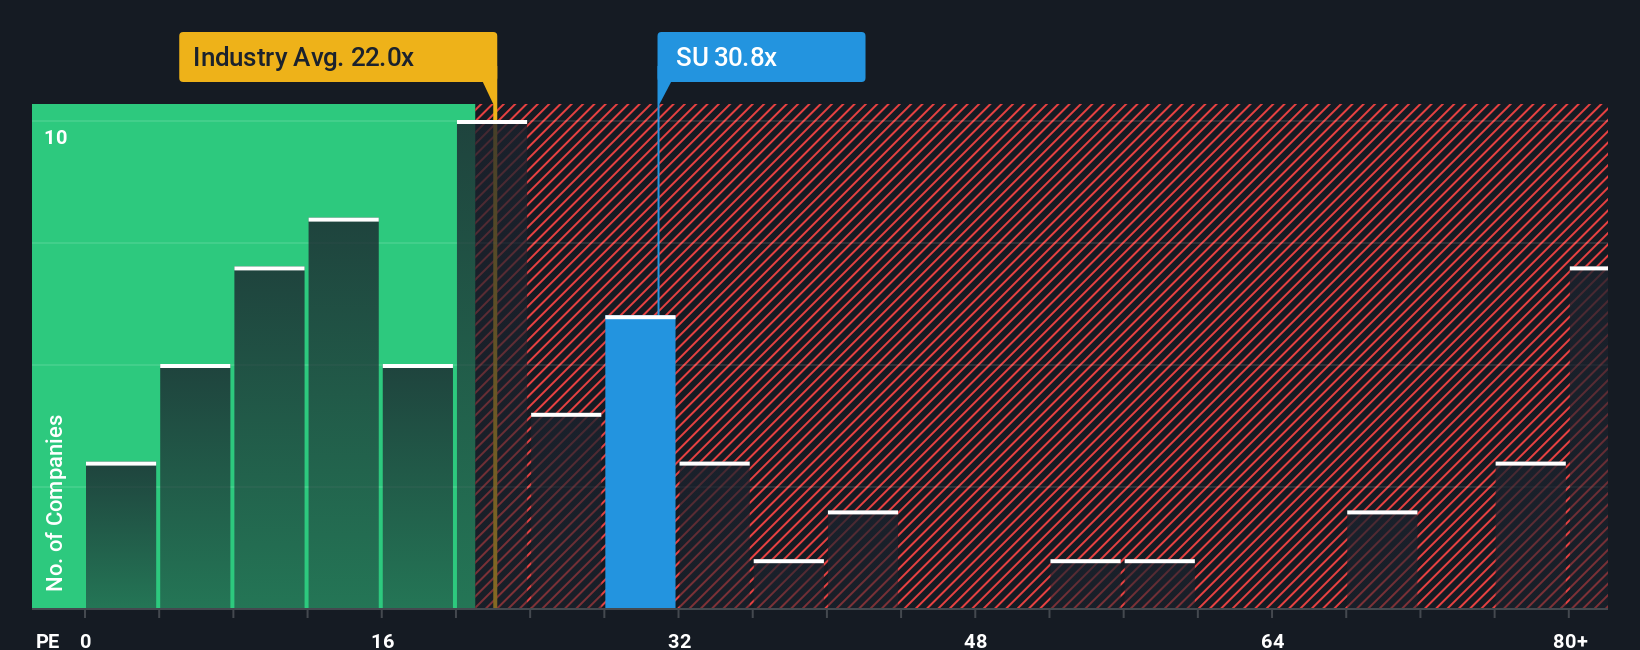
Schneider Electric’s current PE ratio stands at 29.1x. This is slightly below the Electrical industry average of 29.4x and sits higher than its selected peer group, which averages 24.4x. While these direct comparisons are helpful, they miss important nuances about Schneider’s unique growth outlook, profit quality, and risk factors.
That is where Simply Wall St’s proprietary “Fair Ratio” metric comes in. The Fair Ratio for Schneider Electric is calculated at 34.1x, reflecting not just the industry and peer benchmarks but also integrating variables like company growth, margins, market cap, and risk. By considering these deeper factors, the Fair Ratio gives a more customized and relevant perspective than peer or industry averages alone.
Comparing the Fair Ratio of 34.1x to Schneider Electric’s actual PE of 29.1x suggests the shares are trading at a discount to their tailored valuation. This implies there could be value left on the table for investors looking for quality in the sector.
Result: UNDERVALUED
PE ratios tell one story, but what if the real opportunity lies elsewhere? Discover 1420 companies where insiders are betting big on explosive growth.
Upgrade Your Decision Making: Choose your Schneider Electric Narrative
Earlier, we mentioned there is an even better way to understand valuation. Let’s introduce you to Narratives. A Narrative is your story about a company: a clear, straightforward explanation of its outlook, paired with your own assumptions for future growth, margins, and fair value. Narratives connect what you believe about Schneider Electric’s strategy, industry changes, and risks directly to a tailored financial forecast. The result is a price target that reflects your perspective.
With Narratives on Simply Wall St’s Community page, anyone can put their view in context. It is as simple as picking your numbers and rationale, with updates delivered automatically as new news and earnings emerge. Narratives help you decide whether to buy, sell, or hold by showing how your personalized fair value stacks up against the latest market price. This enables real-time, evidence-based investment decisions.
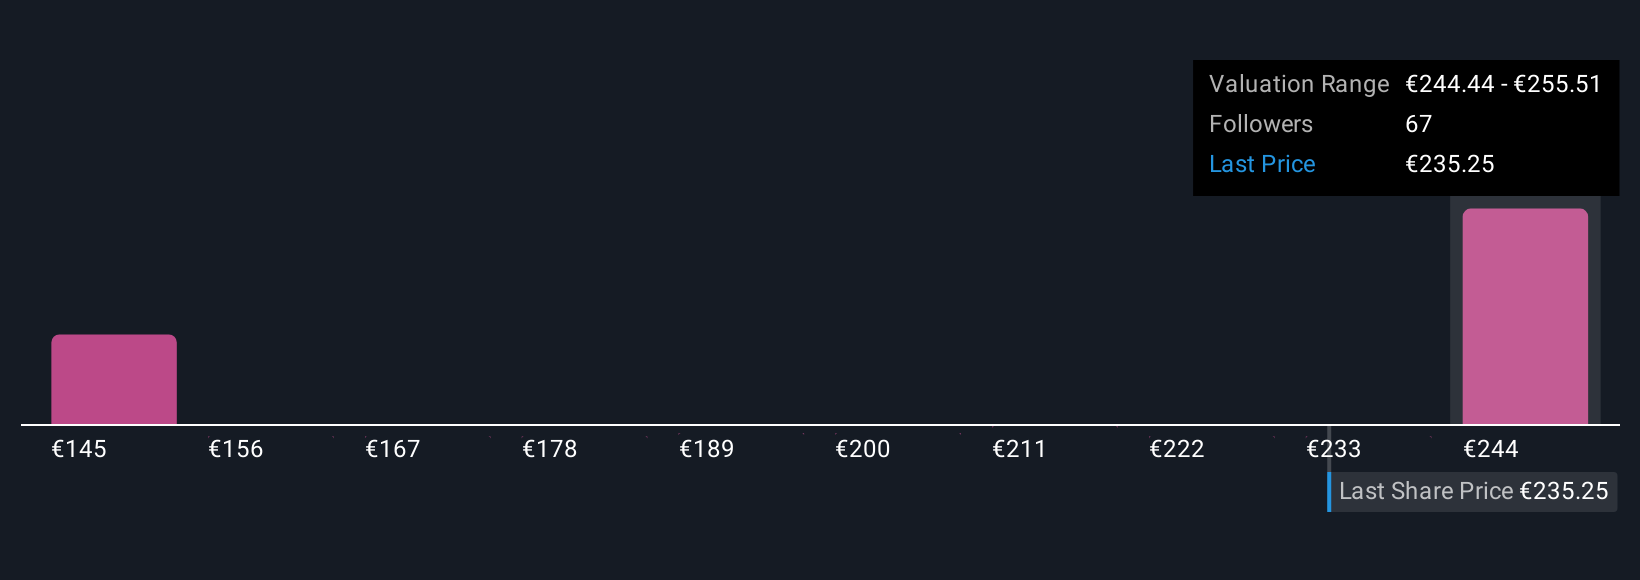
For example, recent Narratives for Schneider Electric show a bullish case driven by strong growth in data centers and digital services, with a price target of €289.0. A more cautious bear sees risks around margin pressures and puts the target at just €220.0. Whatever your view, Narratives make it easier to invest with conviction and to adapt quickly when the story changes.
Do you think there's more to the story for Schneider Electric? Head over to our Community to see what others are saying!
This article by Simply Wall St is general in nature. We provide commentary based on historical data and analyst forecasts only using an unbiased methodology and our articles are not intended to be financial advice. It does not constitute a recommendation to buy or sell any stock, and does not take account of your objectives, or your financial situation. We aim to bring you long-term focused analysis driven by fundamental data. Note that our analysis may not factor in the latest price-sensitive company announcements or qualitative material. Simply Wall St has no position in any stocks mentioned.
New: Manage All Your Stock Portfolios in One Place
We've created the ultimate portfolio companion for stock investors, and it's free.
• Connect an unlimited number of Portfolios and see your total in one currency
• Be alerted to new Warning Signs or Risks via email or mobile
• Track the Fair Value of your stocks
Have feedback on this article? Concerned about the content? Get in touch with us directly. Alternatively, email editorial-team@simplywallst.com
About ENXTPA:SU
Schneider Electric
Engages in the energy management and industrial automation businesses worldwide.
Proven track record with adequate balance sheet and pays a dividend.
Similar Companies
Market Insights

Advertisement
Community Narratives
MicroVision will explode future revenue by 380.37% with a vision towards success
Fair Value US$60.00|98.4% undervalued
TH
Community Contributor
The Indispensable Artery for a New North American Economy
Fair Value CA$132.87|1.3% undervalued
TI
Community Contributor