Advertisement
- France
- /
- Trade Distributors
- /
- ENXTPA:RXL
How Should Investors View Rexel After New ESG Initiatives and Strong Share Performance in 2025?

Simply Wall St
Reviewed by Simply Wall St
Wondering whether Rexel is still a smart pick or if the stock has run too far, too fast? You are hardly alone. For many investors, the recent ups and downs in Rexel’s share price have brought both apprehension and excitement, as well as plenty of opportunity for debate. After all, with shares retreating by about 1.1% over the past week and 1.8% in the past month, you might think the rally has fizzled. But step back a bit, and the bigger picture tells a different story: Rexel’s year-to-date return stands at just under 14%, and the stock has more than doubled over three years, soaring 227% in five years. That kind of long-term strength attracts attention, especially when European industrial and distributor stocks have been responding to evolving energy trends and economic outlooks worldwide.
Of course, those numbers raise the key question: is Rexel still undervalued, or are you paying a premium for past performance? Based on six common valuation checks, Rexel currently scores a 2, only passing two of the under-valuation tests. So what does that mean for the potential upside? In the next section, we will look at those valuation checks in detail. If you want a better way to assess value, keep reading, as there is more to the story than meets the eye.
Rexel scores just 2/6 on our valuation checks. See what other red flags we found in the full valuation breakdown.Approach 1: Rexel Discounted Cash Flow (DCF) Analysis
A Discounted Cash Flow (DCF) model estimates a company’s intrinsic value by projecting its future cash flows and discounting them back to today’s value. This method offers a detailed, forward-looking snapshot of what a company may truly be worth, beyond just its current income or assets.
For Rexel, the current Free Cash Flow stands at €560 million. Analyst projections guide estimates for the next several years, with Simply Wall St extrapolating figures further out to account for longer-term trends. Over the next decade, Rexel’s annual Free Cash Flow is projected to rise modestly, reaching around €693 million by 2035. This reflects a gradual but consistent growth path.
Applying these cash flow forecasts, the DCF model determines Rexel’s intrinsic value at €28.71 per share. Currently, the market price suggests Rexel is trading at a 3.5% discount to this intrinsic value. In practical terms, this suggests the stock is trading very close to its fair value, giving investors little margin of safety but also no glaring overvaluation.
Result: ABOUT RIGHT
Head to the Valuation section of our Company Report for more details on how we arrive at this Fair Value for Rexel.
Approach 2: Rexel Price vs Earnings
The Price-to-Earnings (PE) ratio is the preferred multiple for valuing profitable companies like Rexel because it directly relates a company’s market price to its actual earnings. This gives investors a quick sense of how much they are paying for each euro of profit. In general, companies with stronger growth prospects or lower risk profiles can justify higher PE ratios. Slower-growing or riskier businesses typically command lower multiples.
Currently, Rexel trades at a PE ratio of 33x. This is notably higher than the Trade Distributors industry average of 15.5x and also sits just below the peer average of 35.2x. However, relying solely on these benchmarks can be misleading, as they do not always account for Rexel’s specific growth trends, profit margins, or risk profile.
This is where Simply Wall St’s “Fair Ratio” comes into play. The Fair Ratio is a tailored benchmark that considers a range of factors, including Rexel’s earnings growth, industry group, profit margins, market cap, and individual business risks. For Rexel, the Fair Ratio is set at 30.2x. Compared with its current PE ratio of 33x, the slight premium suggests that the stock is valued just above what would be expected, but not by a wide margin.
Result: ABOUT RIGHT

Upgrade Your Decision Making: Choose your Rexel Narrative
Earlier we mentioned that there is an even better way to understand valuation, so let us introduce you to Narratives. A Narrative is your own clear, personalized story about a company, where you weave together its business outlook and industry context with your fair value and forecasts for future revenue, earnings, and profit margins. Narratives bridge the gap between the numbers and the big picture, allowing you to connect your investment thesis directly to a financial forecast and resulting fair value. This makes your reasoning transparent, repeatable, and easy to adjust.
Simply Wall St’s Community page makes creating and sharing Narratives easy and interactive, helping millions of investors bring their perspectives to life. Narratives help you decide when to buy or sell by highlighting the gap between Fair Value and the current Price. They constantly update as new information, such as news or earnings, emerges.
For example, some investors currently see Rexel’s fair value as high as €33.0 per share by modeling robust growth from digital sales and North American expansion, while others are more cautious, setting their fair value as low as €18.0 due to competitive risks and uncertain margins. The Narrative approach lets you choose the path that best matches your research and expectations.
Do you think there's more to the story for Rexel? Create your own Narrative to let the Community know!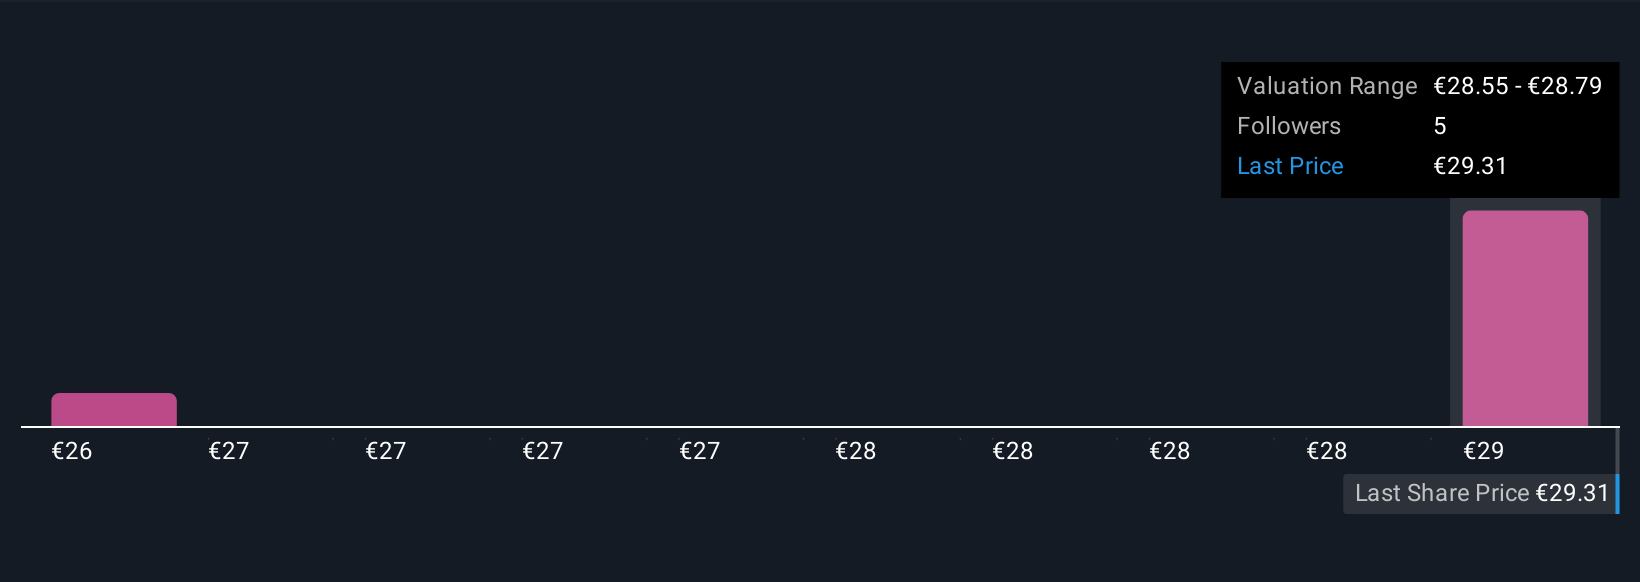
This article by Simply Wall St is general in nature. We provide commentary based on historical data and analyst forecasts only using an unbiased methodology and our articles are not intended to be financial advice. It does not constitute a recommendation to buy or sell any stock, and does not take account of your objectives, or your financial situation. We aim to bring you long-term focused analysis driven by fundamental data. Note that our analysis may not factor in the latest price-sensitive company announcements or qualitative material. Simply Wall St has no position in any stocks mentioned.
New: AI Stock Screener & Alerts
Our new AI Stock Screener scans the market every day to uncover opportunities.
• Dividend Powerhouses (3%+ Yield)
• Undervalued Small Caps with Insider Buying
• High growth Tech and AI Companies
Or build your own from over 50 metrics.
Have feedback on this article? Concerned about the content? Get in touch with us directly. Alternatively, email editorial-team@simplywallst.com
About ENXTPA:RXL
Rexel
Engages in the distribution of low and ultra-low voltage electrical products for the residential, commercial, and industrial markets in France, rest of Europe, North America, and the Asia-Pacific.
Adequate balance sheet with slight risk.
Similar Companies
Market Insights

Advertisement
Community Narratives
The "Molecular Pencil": Why Beam's Technology is Built to Win
Fair Value US$65.01|65.4% undervalued
DA
Community Contributor
The silent giant behind virtually every advanced chip powering AI, smartphones, and modern infrastructure.
Fair Value US$310.00|6.1% undervalued
OS
Community Contributor
ADP Stock: Solid Fundamentals, But AI Investments Test Its Margin Resilience
Fair Value US$387.77|34.2% undervalued
YI
Community Contributor
MINISO's fair value is projected at 26.69 with an anticipated PE ratio shift of 20x
Fair Value US$24.03|9.6% undervalued
BE
Community Contributor