
Advertisement
- France
- /
- Construction
- /
- ENXTPA:DG
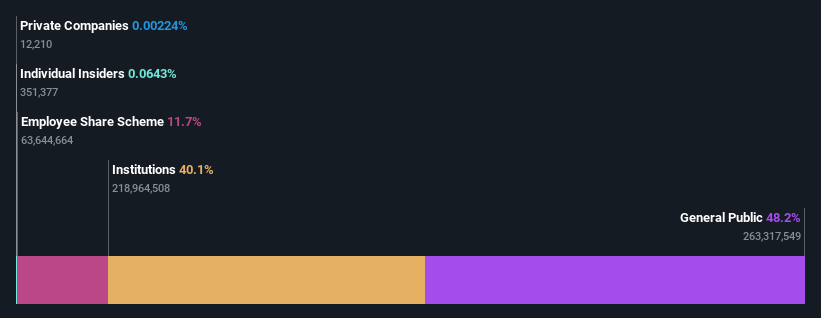
Institutions own 40% of Vinci SA (EPA:DG) shares but retail investors control 48% of the company
Key Insights
- Significant control over Vinci by retail investors implies that the general public has more power to influence management and governance-related decisions
- 42% of the business is held by the top 25 shareholders
- 40% of Vinci is held by Institutions
A look at the shareholders of Vinci SA (EPA:DG) can tell us which group is most powerful. And the group that holds the biggest piece of the pie are retail investors with 48% ownership. That is, the group stands to benefit the most if the stock rises (or lose the most if there is a downturn).
Meanwhile, institutions make up 40% of the company’s shareholders. Institutions will often hold stock in bigger companies, and we expect to see insiders owning a noticeable percentage of the smaller ones.
Let's delve deeper into each type of owner of Vinci, beginning with the chart below.
Check out our latest analysis for Vinci
What Does The Institutional Ownership Tell Us About Vinci?
Many institutions measure their performance against an index that approximates the local market. So they usually pay more attention to companies that are included in major indices.
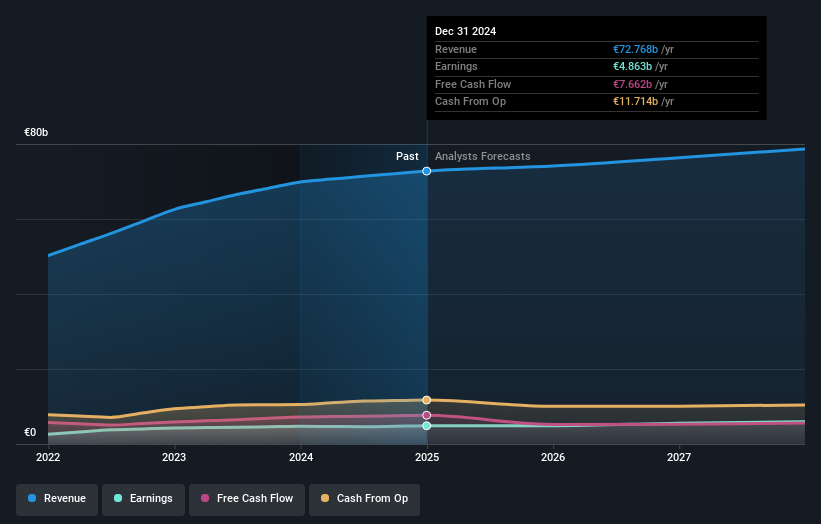
As you can see, institutional investors have a fair amount of stake in Vinci. This implies the analysts working for those institutions have looked at the stock and they like it. But just like anyone else, they could be wrong. If multiple institutions change their view on a stock at the same time, you could see the share price drop fast. It's therefore worth looking at Vinci's earnings history below. Of course, the future is what really matters.
We note that hedge funds don't have a meaningful investment in Vinci. Looking at our data, we can see that the largest shareholder is Vinci SA, ESOP with 12% of shares outstanding. With 6.5% and 3.7% of the shares outstanding respectively, BlackRock, Inc. and The Vanguard Group, Inc. are the second and third largest shareholders.
A deeper look at our ownership data shows that the top 25 shareholders collectively hold less than half of the register, suggesting a large group of small holders where no single shareholder has a majority.
While it makes sense to study institutional ownership data for a company, it also makes sense to study analyst sentiments to know which way the wind is blowing. There are plenty of analysts covering the stock, so it might be worth seeing what they are forecasting, too.
Insider Ownership Of Vinci
While the precise definition of an insider can be subjective, almost everyone considers board members to be insiders. Company management run the business, but the CEO will answer to the board, even if he or she is a member of it.
Insider ownership is positive when it signals leadership are thinking like the true owners of the company. However, high insider ownership can also give immense power to a small group within the company. This can be negative in some circumstances.
Our data suggests that insiders own under 1% of Vinci SA in their own names. It is a very large company, so it would be surprising to see insiders own a large proportion of the company. Though their holding amounts to less than 1%, we can see that board members collectively own €45m worth of shares (at current prices). It is always good to see at least some insider ownership, but it might be worth checking if those insiders have been selling.
General Public Ownership
With a 48% ownership, the general public, mostly comprising of individual investors, have some degree of sway over Vinci. This size of ownership, while considerable, may not be enough to change company policy if the decision is not in sync with other large shareholders.
Next Steps:
While it is well worth considering the different groups that own a company, there are other factors that are even more important. Case in point: We've spotted 2 warning signs for Vinci you should be aware of.
If you would prefer discover what analysts are predicting in terms of future growth, do not miss this free report on analyst forecasts.
NB: Figures in this article are calculated using data from the last twelve months, which refer to the 12-month period ending on the last date of the month the financial statement is dated. This may not be consistent with full year annual report figures.
New: Manage All Your Stock Portfolios in One Place
We've created the ultimate portfolio companion for stock investors, and it's free.
• Connect an unlimited number of Portfolios and see your total in one currency
• Be alerted to new Warning Signs or Risks via email or mobile
• Track the Fair Value of your stocks
Have feedback on this article? Concerned about the content? Get in touch with us directly. Alternatively, email editorial-team (at) simplywallst.com.
This article by Simply Wall St is general in nature. We provide commentary based on historical data and analyst forecasts only using an unbiased methodology and our articles are not intended to be financial advice. It does not constitute a recommendation to buy or sell any stock, and does not take account of your objectives, or your financial situation. We aim to bring you long-term focused analysis driven by fundamental data. Note that our analysis may not factor in the latest price-sensitive company announcements or qualitative material. Simply Wall St has no position in any stocks mentioned.
About ENXTPA:DG
Vinci
Engages in concessions, energy, and construction businesses in France and internationally.
Adequate balance sheet average dividend payer.
Similar Companies
Market Insights

Advertisement
Community Narratives
The "Molecular Pencil": Why Beam's Technology is Built to Win
Fair Value US$65.01|66.7% undervalued
DA
Community Contributor
The silent giant behind virtually every advanced chip powering AI, smartphones, and modern infrastructure.
Fair Value US$310.00|4.8% undervalued
OS
Community Contributor
ADP Stock: Solid Fundamentals, But AI Investments Test Its Margin Resilience
Fair Value US$387.77|34.5% undervalued
YI
Community Contributor