- France
- /
- Auto Components
- /
- ENXTPA:FR
Valeo (EPA:FR shareholders incur further losses as stock declines 5.6% this week, taking three-year losses to 58%


The truth is that if you invest for long enough, you're going to end up with some losing stocks. Long term Valeo SE (EPA:FR) shareholders know that all too well, since the share price is down considerably over three years. So they might be feeling emotional about the 61% share price collapse, in that time. And the ride hasn't got any smoother in recent times over the last year, with the price 47% lower in that time. Even worse, it's down 11% in about a month, which isn't fun at all.
Since Valeo has shed €160m from its value in the past 7 days, let's see if the longer term decline has been driven by the business' economics.
See our latest analysis for Valeo
To paraphrase Benjamin Graham: Over the short term the market is a voting machine, but over the long term it's a weighing machine. One way to examine how market sentiment has changed over time is to look at the interaction between a company's share price and its earnings per share (EPS).
Valeo became profitable within the last five years. We would usually expect to see the share price rise as a result. So given the share price is down it's worth checking some other metrics too.
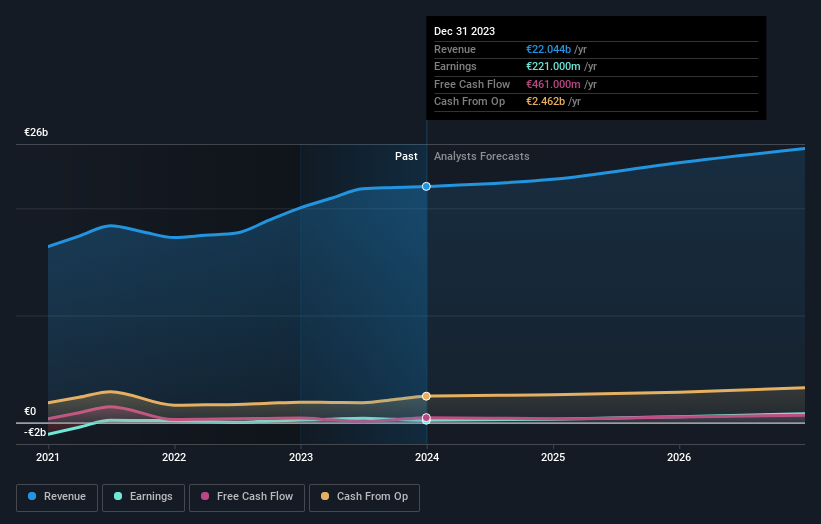
We note that, in three years, revenue has actually grown at a 10.0% annual rate, so that doesn't seem to be a reason to sell shares. This analysis is just perfunctory, but it might be worth researching Valeo more closely, as sometimes stocks fall unfairly. This could present an opportunity.
You can see how earnings and revenue have changed over time in the image below (click on the chart to see the exact values).
Valeo is a well known stock, with plenty of analyst coverage, suggesting some visibility into future growth. So it makes a lot of sense to check out what analysts think Valeo will earn in the future (free analyst consensus estimates)
What About Dividends?
As well as measuring the share price return, investors should also consider the total shareholder return (TSR). The TSR is a return calculation that accounts for the value of cash dividends (assuming that any dividend received was reinvested) and the calculated value of any discounted capital raisings and spin-offs. Arguably, the TSR gives a more comprehensive picture of the return generated by a stock. In the case of Valeo, it has a TSR of -58% for the last 3 years. That exceeds its share price return that we previously mentioned. This is largely a result of its dividend payments!
A Different Perspective
While the broader market gained around 6.8% in the last year, Valeo shareholders lost 46% (even including dividends). However, keep in mind that even the best stocks will sometimes underperform the market over a twelve month period. Regrettably, last year's performance caps off a bad run, with the shareholders facing a total loss of 9% per year over five years. We realise that Baron Rothschild has said investors should "buy when there is blood on the streets", but we caution that investors should first be sure they are buying a high quality business. I find it very interesting to look at share price over the long term as a proxy for business performance. But to truly gain insight, we need to consider other information, too. Consider for instance, the ever-present spectre of investment risk. We've identified 3 warning signs with Valeo , and understanding them should be part of your investment process.
We will like Valeo better if we see some big insider buys. While we wait, check out this free list of undervalued stocks (mostly small caps) with considerable, recent, insider buying.
Please note, the market returns quoted in this article reflect the market weighted average returns of stocks that currently trade on French exchanges.
New: Manage All Your Stock Portfolios in One Place
We've created the ultimate portfolio companion for stock investors, and it's free.
• Connect an unlimited number of Portfolios and see your total in one currency
• Be alerted to new Warning Signs or Risks via email or mobile
• Track the Fair Value of your stocks
Have feedback on this article? Concerned about the content? Get in touch with us directly. Alternatively, email editorial-team (at) simplywallst.com.
This article by Simply Wall St is general in nature. We provide commentary based on historical data and analyst forecasts only using an unbiased methodology and our articles are not intended to be financial advice. It does not constitute a recommendation to buy or sell any stock, and does not take account of your objectives, or your financial situation. We aim to bring you long-term focused analysis driven by fundamental data. Note that our analysis may not factor in the latest price-sensitive company announcements or qualitative material. Simply Wall St has no position in any stocks mentioned.
About ENXTPA:FR
Valeo
Designs, produces, and sells products and systems for automakers in France, other European countries, Africa, North America, South America, and Asia.
Good value slight.

