
Advertisement
If you're looking for a multi-bagger, there's a few things to keep an eye out for. Ideally, a business will show two trends; firstly a growing return on capital employed (ROCE) and secondly, an increasing amount of capital employed. Ultimately, this demonstrates that it's a business that is reinvesting profits at increasing rates of return. In light of that, when we looked at Burelle (EPA:BUR) and its ROCE trend, we weren't exactly thrilled.
Understanding Return On Capital Employed (ROCE)
For those that aren't sure what ROCE is, it measures the amount of pre-tax profits a company can generate from the capital employed in its business. To calculate this metric for Burelle, this is the formula:
Return on Capital Employed = Earnings Before Interest and Tax (EBIT) ÷ (Total Assets - Current Liabilities)
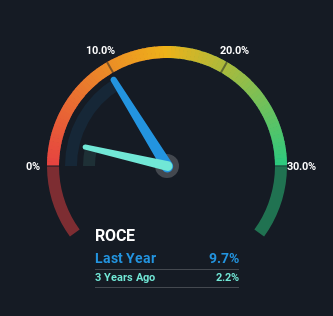
0.097 = €350m ÷ (€8.0b - €4.4b) (Based on the trailing twelve months to December 2023).
So, Burelle has an ROCE of 9.7%. In absolute terms, that's a low return but it's around the Auto Components industry average of 8.9%.
See our latest analysis for Burelle
While the past is not representative of the future, it can be helpful to know how a company has performed historically, which is why we have this chart above. If you want to delve into the historical earnings , check out these free graphs detailing revenue and cash flow performance of Burelle.
What Does the ROCE Trend For Burelle Tell Us?
Over the past five years, Burelle's ROCE and capital employed have both remained mostly flat. It's not uncommon to see this when looking at a mature and stable business that isn't re-investing its earnings because it has likely passed that phase of the business cycle. With that in mind, unless investment picks up again in the future, we wouldn't expect Burelle to be a multi-bagger going forward.
Another point to note, we noticed the company has increased current liabilities over the last five years. This is intriguing because if current liabilities hadn't increased to 55% of total assets, this reported ROCE would probably be less than9.7% because total capital employed would be higher.The 9.7% ROCE could be even lower if current liabilities weren't 55% of total assets, because the the formula would show a larger base of total capital employed. Additionally, this high level of current liabilities isn't ideal because it means the company's suppliers (or short-term creditors) are effectively funding a large portion of the business.
What We Can Learn From Burelle's ROCE
In a nutshell, Burelle has been trudging along with the same returns from the same amount of capital over the last five years. Since the stock has declined 47% over the last five years, investors may not be too optimistic on this trend improving either. In any case, the stock doesn't have these traits of a multi-bagger discussed above, so if that's what you're looking for, we think you'd have more luck elsewhere.
Burelle does have some risks, we noticed 3 warning signs (and 1 which is significant) we think you should know about.
For those who like to invest in solid companies, check out this free list of companies with solid balance sheets and high returns on equity.
Valuation is complex, but we're here to simplify it.
Discover if Burelle might be undervalued or overvalued with our detailed analysis, featuring fair value estimates, potential risks, dividends, insider trades, and its financial condition.
Access Free AnalysisHave feedback on this article? Concerned about the content? Get in touch with us directly. Alternatively, email editorial-team (at) simplywallst.com.
This article by Simply Wall St is general in nature. We provide commentary based on historical data and analyst forecasts only using an unbiased methodology and our articles are not intended to be financial advice. It does not constitute a recommendation to buy or sell any stock, and does not take account of your objectives, or your financial situation. We aim to bring you long-term focused analysis driven by fundamental data. Note that our analysis may not factor in the latest price-sensitive company announcements or qualitative material. Simply Wall St has no position in any stocks mentioned.
About ENXTPA:BUR
Burelle
Through its subsidiaries, provides automotive equipment in France and internationally.
Good value with adequate balance sheet and pays a dividend.
Market Insights

Advertisement
Community Narratives
MicroVision will explode future revenue by 380.37% with a vision towards success
Fair Value US$60.00|98.4% undervalued
TH
Community Contributor
The Indispensable Artery for a New North American Economy
Fair Value CA$132.87|1.3% undervalued
TI
Community Contributor