Advertisement
- Spain
- /
- Hospitality
- /
- BME:HBX
Does the Recent Share Price Drop Signal Opportunity for HBX Group International in 2025?

Simply Wall St
Reviewed by Bailey Pemberton
Trying to figure out whether to hold, buy, or steer clear of HBX Group International? You are not alone. With HBX’s stock closing at $7.24 recently, the conversation around its next move is getting more interesting by the day. Over the last week, the price crept up by 1.4%, but that follows a rough patch. The stock is still down 6.6% over the past month and a hefty 34.2% since the start of the year. Such swings often reflect changing perceptions of risk, but they can also signal opportunity, especially if the market is overreacting or overlooking something.
Much of this volatility has come amid broader market debates, with investors weighing global economic trends and shifting appetites for riskier international holdings. It is the kind of climate where undervalued stocks can get lost in the shuffle. This brings us to HBX’s current valuation. Out of six standard valuation checks, the company scores a 3 for being undervalued in half the areas analysts typically watch.
So is HBX really flying under the radar, or are investors correctly pricing in some risks? Let’s break down how the market is assessing the company using a range of valuation approaches. Stick around, because the best way to judge value might just be something even more insightful than these traditional checks.
Approach 1: HBX Group International Discounted Cash Flow (DCF) Analysis
The Discounted Cash Flow (DCF) model estimates a company’s worth by projecting its future cash flows, then discounting those values back to today using an appropriate rate. This approach aims to reflect what all those future Euros are really worth to investors in the present moment.
HBX Group International’s most recent reported Free Cash Flow (FCF) stands at €131.5 million. Analysts expect the company’s annual FCF to grow steadily, with projections reaching €380 million by 2028. Beyond five years, further FCF estimates are extrapolated, giving us a view of the company’s potential over the next decade.
When all these future cash flows are added up and discounted to today’s terms, the DCF model places HBX’s intrinsic value at €19.94 per share, which is significantly above its recent share price of €7.24. This implies the stock is trading at a 63.7% discount to its estimated fair value.
In summary, the DCF analysis strongly suggests that HBX Group International is notably undervalued by the market at current levels.
Result: UNDERVALUED
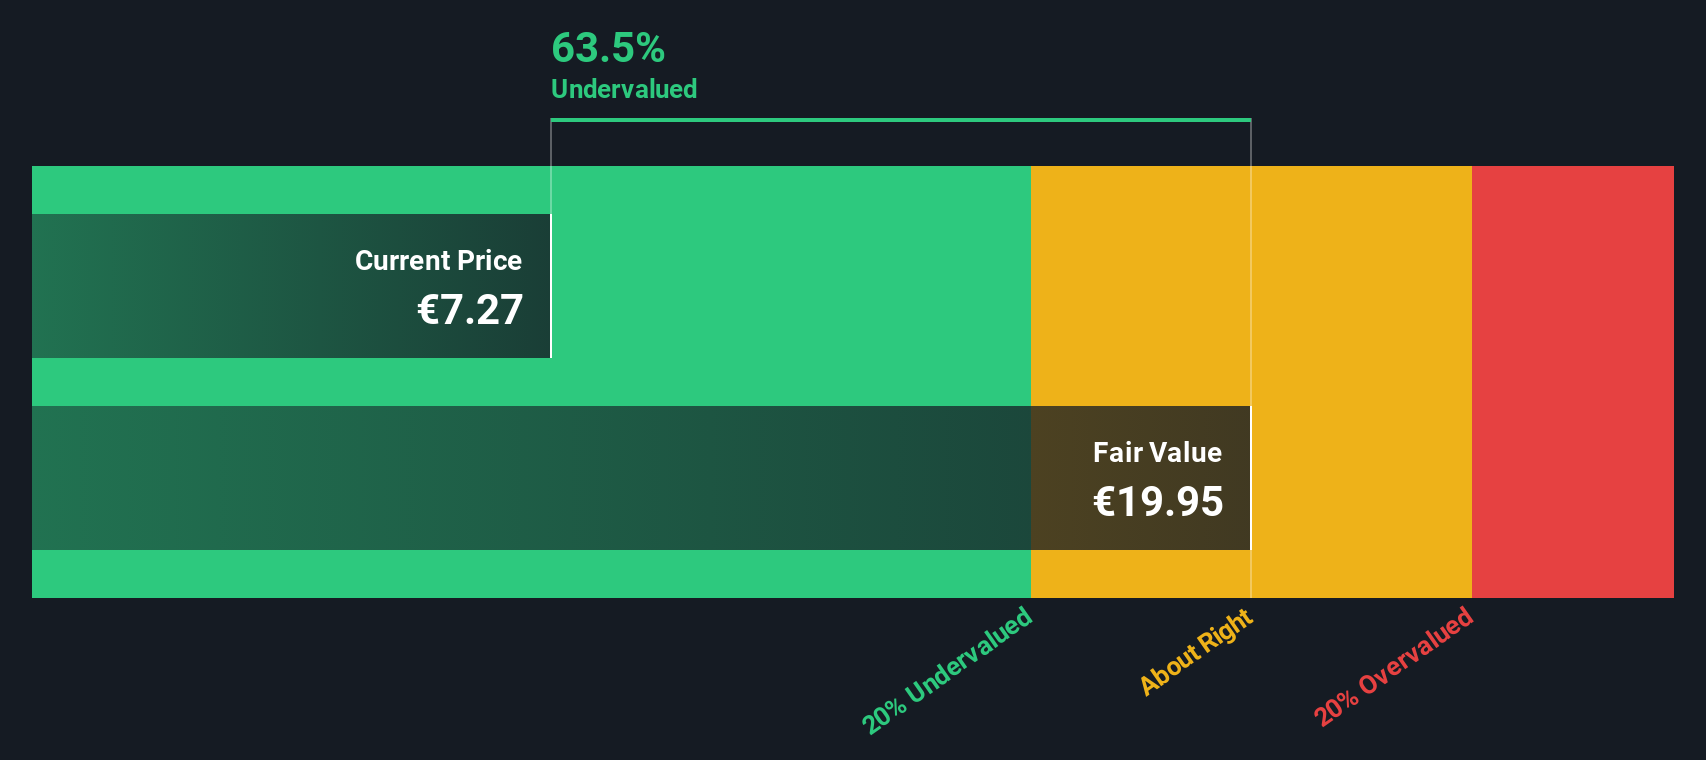
Our Discounted Cash Flow (DCF) analysis suggests HBX Group International is undervalued by 63.7%. Track this in your watchlist or portfolio, or discover more undervalued stocks.
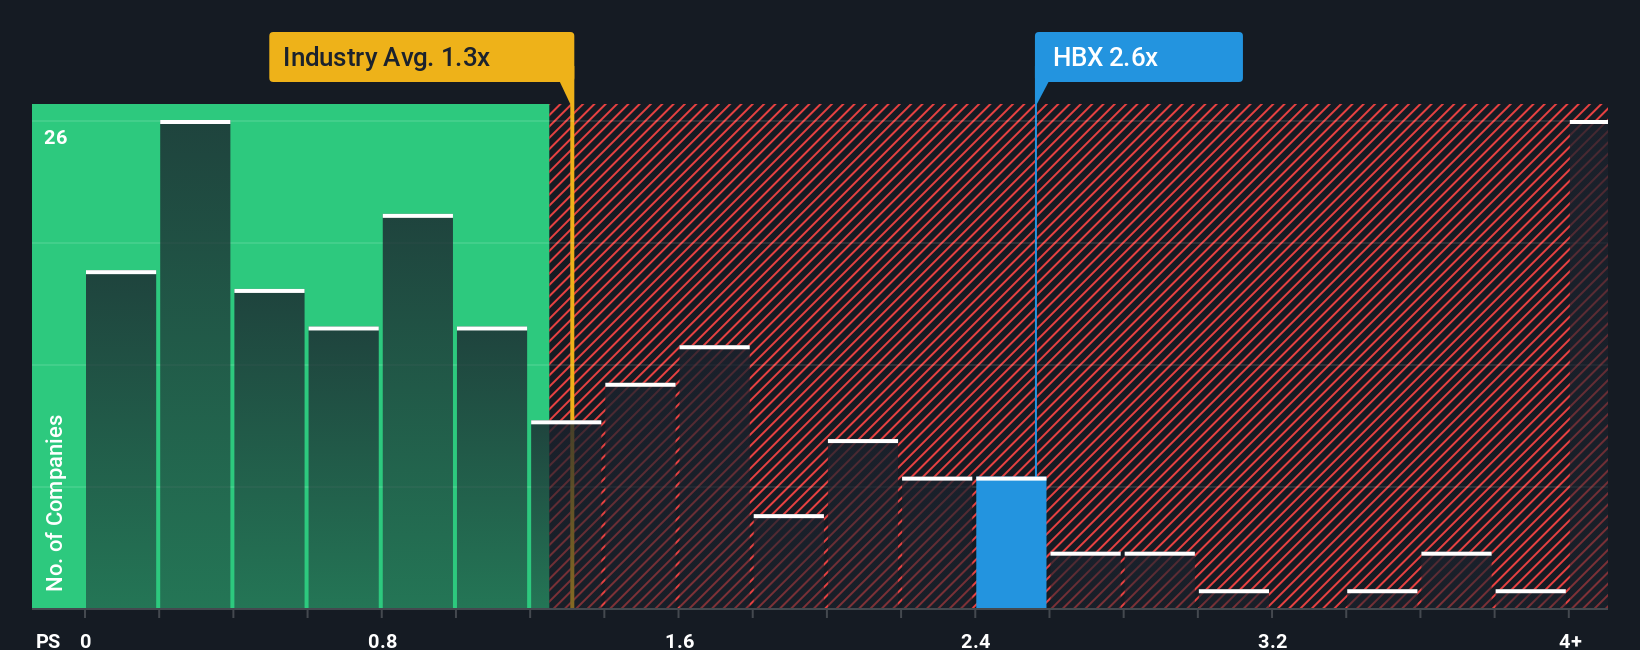
Approach 2: HBX Group International Price vs Sales
For companies like HBX Group International, which are steadily generating revenue, the Price-to-Sales (P/S) ratio offers a useful lens for valuation. This multiple is often preferred when assessing companies that may not yet be highly profitable but still have solid sales. This situation is common in the hospitality industry and with growing businesses.
Growth prospects and risk level heavily influence what a “normal” or “fair” P/S ratio should be. Investors tend to pay a higher multiple for companies with stronger sales growth and more predictable results. Businesses with uncertain outlooks or lower expected growth generally command lower P/S ratios.
Currently, HBX Group International trades at a P/S ratio of 2.48x. That places it above the hospitality industry average of 1.56x but well below the peer group average of 5.98x. To add more nuance, Simply Wall St calculates a proprietary “Fair Ratio” for HBX Group International, which is 2.00x. The Fair Ratio method builds on traditional benchmarking by adjusting for unique factors like HBX’s growth outlook, risk profile, profit margins, industry characteristics, and market capitalization. This approach offers a more tailored perspective than a simple industry or peer comparison alone.
Comparing the Fair Ratio (2.00x) with HBX’s current P/S (2.48x) reveals the stock is slightly above its fair value by this measure, indicating investors might be paying a modest premium.
Result: OVERVALUED
PS ratios tell one story, but what if the real opportunity lies elsewhere? Discover companies where insiders are betting big on explosive growth.
Upgrade Your Decision Making: Choose your HBX Group International Narrative
Earlier, we mentioned that there is an even smarter way to understand valuation, so let’s introduce you to Narratives. A Narrative is your personalized story about a company, blending your perspective on its future growth, risks, and profitability into a forecast and an estimated fair value. Simply put, while traditional valuations look only at the numbers, Narratives connect those numbers to the unique context and outlook you believe in, making investment decisions more relevant to you.
Narratives are an easy, interactive tool on the Simply Wall St platform, available right on the Community page where millions of investors refine their ideas. They let you clearly see how your assumptions about HBX Group International’s prospects turn into a Fair Value, and by comparing this Fair Value to the current Price, you can decide when to buy or sell with much more confidence.
The best part is, Narratives update automatically as new information, such as news or quarterly results, becomes available, keeping your outlook up to date in real time. For example, some HBX Group International investors might see immense upside and set a high Fair Value, while others may set a much lower value based on more conservative future expectations.
Do you think there's more to the story for HBX Group International? Create your own Narrative to let the Community know!
This article by Simply Wall St is general in nature. We provide commentary based on historical data and analyst forecasts only using an unbiased methodology and our articles are not intended to be financial advice. It does not constitute a recommendation to buy or sell any stock, and does not take account of your objectives, or your financial situation. We aim to bring you long-term focused analysis driven by fundamental data. Note that our analysis may not factor in the latest price-sensitive company announcements or qualitative material. Simply Wall St has no position in any stocks mentioned.
Valuation is complex, but we're here to simplify it.
Discover if HBX Group International might be undervalued or overvalued with our detailed analysis, featuring fair value estimates, potential risks, dividends, insider trades, and its financial condition.
Access Free AnalysisHave feedback on this article? Concerned about the content? Get in touch with us directly. Alternatively, email editorial-team@simplywallst.com
About BME:HBX
HBX Group International
Engages in the intermediation of hotel accommodation.
High growth potential and fair value.
Similar Companies
Market Insights

Advertisement
Community Narratives
MicroVision will explode future revenue by 380.37% with a vision towards success
Fair Value US$60.00|98.4% undervalued
TH
Community Contributor
The Indispensable Artery for a New North American Economy
Fair Value CA$132.87|1.3% undervalued
TI
Community Contributor