Investors in Novo Nordisk (CPH:NOVO B) have seen enviable returns of 548% over the past five years


Long term investing can be life changing when you buy and hold the truly great businesses. And we've seen some truly amazing gains over the years. Don't believe it? Then look at the Novo Nordisk A/S (CPH:NOVO B) share price. It's 496% higher than it was five years ago. This just goes to show the value creation that some businesses can achieve. On top of that, the share price is up 10% in about a quarter. But this move may well have been assisted by the reasonably buoyant market (up 7.7% in 90 days).
With that in mind, it's worth seeing if the company's underlying fundamentals have been the driver of long term performance, or if there are some discrepancies.
Check out our latest analysis for Novo Nordisk
While the efficient markets hypothesis continues to be taught by some, it has been proven that markets are over-reactive dynamic systems, and investors are not always rational. One imperfect but simple way to consider how the market perception of a company has shifted is to compare the change in the earnings per share (EPS) with the share price movement.
During five years of share price growth, Novo Nordisk achieved compound earnings per share (EPS) growth of 20% per year. This EPS growth is slower than the share price growth of 43% per year, over the same period. So it's fair to assume the market has a higher opinion of the business than it did five years ago. And that's hardly shocking given the track record of growth. This optimism is visible in its fairly high P/E ratio of 46.58.
The company's earnings per share (over time) is depicted in the image below (click to see the exact numbers).
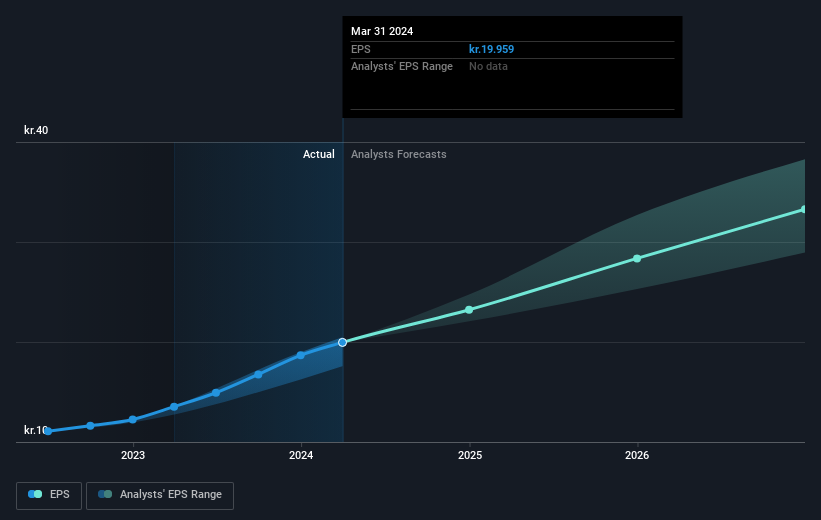
We know that Novo Nordisk has improved its bottom line lately, but is it going to grow revenue? Check if analysts think Novo Nordisk will grow revenue in the future.
What About Dividends?
As well as measuring the share price return, investors should also consider the total shareholder return (TSR). The TSR is a return calculation that accounts for the value of cash dividends (assuming that any dividend received was reinvested) and the calculated value of any discounted capital raisings and spin-offs. Arguably, the TSR gives a more comprehensive picture of the return generated by a stock. In the case of Novo Nordisk, it has a TSR of 548% for the last 5 years. That exceeds its share price return that we previously mentioned. The dividends paid by the company have thusly boosted the total shareholder return.
A Different Perspective
It's nice to see that Novo Nordisk shareholders have received a total shareholder return of 69% over the last year. Of course, that includes the dividend. That gain is better than the annual TSR over five years, which is 45%. Therefore it seems like sentiment around the company has been positive lately. Someone with an optimistic perspective could view the recent improvement in TSR as indicating that the business itself is getting better with time. While it is well worth considering the different impacts that market conditions can have on the share price, there are other factors that are even more important. To that end, you should learn about the 2 warning signs we've spotted with Novo Nordisk (including 1 which is potentially serious) .
Of course Novo Nordisk may not be the best stock to buy. So you may wish to see this free collection of growth stocks.
Please note, the market returns quoted in this article reflect the market weighted average returns of stocks that currently trade on Danish exchanges.
Valuation is complex, but we're here to simplify it.
Discover if Novo Nordisk might be undervalued or overvalued with our detailed analysis, featuring fair value estimates, potential risks, dividends, insider trades, and its financial condition.
Access Free AnalysisHave feedback on this article? Concerned about the content? Get in touch with us directly. Alternatively, email editorial-team (at) simplywallst.com.
This article by Simply Wall St is general in nature. We provide commentary based on historical data and analyst forecasts only using an unbiased methodology and our articles are not intended to be financial advice. It does not constitute a recommendation to buy or sell any stock, and does not take account of your objectives, or your financial situation. We aim to bring you long-term focused analysis driven by fundamental data. Note that our analysis may not factor in the latest price-sensitive company announcements or qualitative material. Simply Wall St has no position in any stocks mentioned.
About CPSE:NOVO B
Novo Nordisk
Engages in the research and development, manufacture, and distribution of pharmaceutical products in Europe, the Middle East, Africa, Mainland China, Hong Kong, Taiwan, North America, and internationally.
Solid track record and good value.

