Stock Analysis
Are Strong Financial Prospects The Force That Is Driving The Momentum In SP Group A/S' CPH:SPG) Stock?


Most readers would already be aware that SP Group's (CPH:SPG) stock increased significantly by 36% over the past three months. Given that the market rewards strong financials in the long-term, we wonder if that is the case in this instance. Specifically, we decided to study SP Group's ROE in this article.
Return on equity or ROE is a key measure used to assess how efficiently a company's management is utilizing the company's capital. In short, ROE shows the profit each dollar generates with respect to its shareholder investments.
Check out our latest analysis for SP Group
How To Calculate Return On Equity?
Return on equity can be calculated by using the formula:
Return on Equity = Net Profit (from continuing operations) ÷ Shareholders' Equity
So, based on the above formula, the ROE for SP Group is:
11% = kr.159m ÷ kr.1.5b (Based on the trailing twelve months to December 2023).
The 'return' is the profit over the last twelve months. One way to conceptualize this is that for each DKK1 of shareholders' capital it has, the company made DKK0.11 in profit.
What Is The Relationship Between ROE And Earnings Growth?
Thus far, we have learned that ROE measures how efficiently a company is generating its profits. Depending on how much of these profits the company reinvests or "retains", and how effectively it does so, we are then able to assess a company’s earnings growth potential. Generally speaking, other things being equal, firms with a high return on equity and profit retention, have a higher growth rate than firms that don’t share these attributes.
SP Group's Earnings Growth And 11% ROE
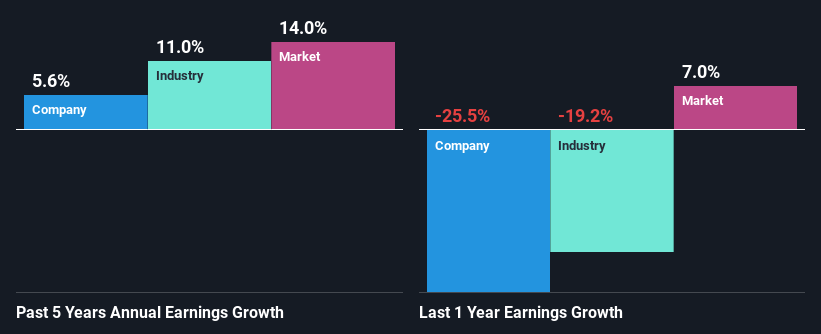
To begin with, SP Group seems to have a respectable ROE. Especially when compared to the industry average of 8.8% the company's ROE looks pretty impressive. This probably laid the ground for SP Group's moderate 5.6% net income growth seen over the past five years.
We then compared SP Group's net income growth with the industry and found that the company's growth figure is lower than the average industry growth rate of 11% in the same 5-year period, which is a bit concerning.
The basis for attaching value to a company is, to a great extent, tied to its earnings growth. What investors need to determine next is if the expected earnings growth, or the lack of it, is already built into the share price. This then helps them determine if the stock is placed for a bright or bleak future. One good indicator of expected earnings growth is the P/E ratio which determines the price the market is willing to pay for a stock based on its earnings prospects. So, you may want to check if SP Group is trading on a high P/E or a low P/E, relative to its industry.
Is SP Group Using Its Retained Earnings Effectively?
SP Group has a low three-year median payout ratio of 21%, meaning that the company retains the remaining 79% of its profits. This suggests that the management is reinvesting most of the profits to grow the business.
Additionally, SP Group has paid dividends over a period of at least ten years which means that the company is pretty serious about sharing its profits with shareholders. Our latest analyst data shows that the future payout ratio of the company over the next three years is expected to be approximately 20%. As a result, SP Group's ROE is not expected to change by much either, which we inferred from the analyst estimate of 11% for future ROE.
Conclusion
On the whole, we feel that SP Group's performance has been quite good. In particular, it's great to see that the company is investing heavily into its business and along with a high rate of return, that has resulted in a respectable growth in its earnings. The latest industry analyst forecasts show that the company is expected to maintain its current growth rate. Are these analysts expectations based on the broad expectations for the industry, or on the company's fundamentals? Click here to be taken to our analyst's forecasts page for the company.
Valuation is complex, but we're helping make it simple.
Find out whether SP Group is potentially over or undervalued by checking out our comprehensive analysis, which includes fair value estimates, risks and warnings, dividends, insider transactions and financial health.
View the Free AnalysisHave feedback on this article? Concerned about the content? Get in touch with us directly. Alternatively, email editorial-team (at) simplywallst.com.
This article by Simply Wall St is general in nature. We provide commentary based on historical data and analyst forecasts only using an unbiased methodology and our articles are not intended to be financial advice. It does not constitute a recommendation to buy or sell any stock, and does not take account of your objectives, or your financial situation. We aim to bring you long-term focused analysis driven by fundamental data. Note that our analysis may not factor in the latest price-sensitive company announcements or qualitative material. Simply Wall St has no position in any stocks mentioned.
About CPSE:SPG
SP Group
Manufactures and sells molded plastic and composite components in Denmark, rest of Europe, the Americas, Asia, the Middle East, Australia, and Africa.
Excellent balance sheet and fair value.
