
Advertisement
Key Insights
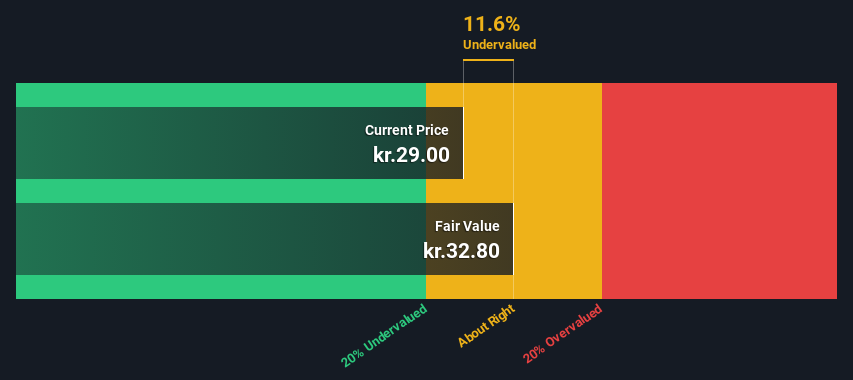
- Using the 2 Stage Free Cash Flow to Equity, Össur hf fair value estimate is kr.32.80
- With kr.29.00 share price, Össur hf appears to be trading close to its estimated fair value
- Analyst price target for OSSR is US$37.10, which is 13% above our fair value estimate
In this article we are going to estimate the intrinsic value of Össur hf. (CPH:OSSR) by taking the expected future cash flows and discounting them to today's value. Our analysis will employ the Discounted Cash Flow (DCF) model. It may sound complicated, but actually it is quite simple!
We generally believe that a company's value is the present value of all of the cash it will generate in the future. However, a DCF is just one valuation metric among many, and it is not without flaws. If you want to learn more about discounted cash flow, the rationale behind this calculation can be read in detail in the Simply Wall St analysis model.
View our latest analysis for Össur hf
The Calculation
We use what is known as a 2-stage model, which simply means we have two different periods of growth rates for the company's cash flows. Generally the first stage is higher growth, and the second stage is a lower growth phase. To start off with, we need to estimate the next ten years of cash flows. Where possible we use analyst estimates, but when these aren't available we extrapolate the previous free cash flow (FCF) from the last estimate or reported value. We assume companies with shrinking free cash flow will slow their rate of shrinkage, and that companies with growing free cash flow will see their growth rate slow, over this period. We do this to reflect that growth tends to slow more in the early years than it does in later years.
Generally we assume that a dollar today is more valuable than a dollar in the future, and so the sum of these future cash flows is then discounted to today's value:
10-year free cash flow (FCF) estimate
| 2024 | 2025 | 2026 | 2027 | 2028 | 2029 | 2030 | 2031 | 2032 | 2033 | |
| Levered FCF ($, Millions) | US$96.5m | US$107.3m | US$114.8m | US$120.6m | US$125.1m | US$128.6m | US$131.3m | US$133.4m | US$135.1m | US$136.6m |
| Growth Rate Estimate Source | Analyst x4 | Analyst x4 | Est @ 7.01% | Est @ 5.07% | Est @ 3.71% | Est @ 2.76% | Est @ 2.09% | Est @ 1.63% | Est @ 1.30% | Est @ 1.07% |
| Present Value ($, Millions) Discounted @ 6.9% | US$90.3 | US$94.0 | US$94.1 | US$92.5 | US$89.8 | US$86.3 | US$82.5 | US$78.4 | US$74.4 | US$70.3 |
("Est" = FCF growth rate estimated by Simply Wall St)
Present Value of 10-year Cash Flow (PVCF) = US$853m
After calculating the present value of future cash flows in the initial 10-year period, we need to calculate the Terminal Value, which accounts for all future cash flows beyond the first stage. The Gordon Growth formula is used to calculate Terminal Value at a future annual growth rate equal to the 5-year average of the 10-year government bond yield of 0.5%. We discount the terminal cash flows to today's value at a cost of equity of 6.9%.
Terminal Value (TV)= FCF2033 × (1 + g) ÷ (r – g) = US$137m× (1 + 0.5%) ÷ (6.9%– 0.5%) = US$2.2b
Present Value of Terminal Value (PVTV)= TV / (1 + r)10= US$2.2b÷ ( 1 + 6.9%)10= US$1.1b
The total value is the sum of cash flows for the next ten years plus the discounted terminal value, which results in the Total Equity Value, which in this case is US$2.0b. To get the intrinsic value per share, we divide this by the total number of shares outstanding. Compared to the current share price of kr.29.0, the company appears about fair value at a 12% discount to where the stock price trades currently. Valuations are imprecise instruments though, rather like a telescope - move a few degrees and end up in a different galaxy. Do keep this in mind.
Important Assumptions
The calculation above is very dependent on two assumptions. The first is the discount rate and the other is the cash flows. Part of investing is coming up with your own evaluation of a company's future performance, so try the calculation yourself and check your own assumptions. The DCF also does not consider the possible cyclicality of an industry, or a company's future capital requirements, so it does not give a full picture of a company's potential performance. Given that we are looking at Össur hf as potential shareholders, the cost of equity is used as the discount rate, rather than the cost of capital (or weighted average cost of capital, WACC) which accounts for debt. In this calculation we've used 6.9%, which is based on a levered beta of 1.007. Beta is a measure of a stock's volatility, compared to the market as a whole. We get our beta from the industry average beta of globally comparable companies, with an imposed limit between 0.8 and 2.0, which is a reasonable range for a stable business.
SWOT Analysis for Össur hf
Strength
- Debt is well covered by earnings and cashflows.
Weakness
- Earnings declined over the past year.
Opportunity
- Annual earnings are forecast to grow faster than the Danish market.
- Current share price is below our estimate of fair value.
Threat
- Annual revenue is forecast to grow slower than the Danish market.
Moving On:
Although the valuation of a company is important, it is only one of many factors that you need to assess for a company. DCF models are not the be-all and end-all of investment valuation. Instead the best use for a DCF model is to test certain assumptions and theories to see if they would lead to the company being undervalued or overvalued. For instance, if the terminal value growth rate is adjusted slightly, it can dramatically alter the overall result. For Össur hf, we've put together three important items you should look at:
- Risks: You should be aware of the 1 warning sign for Össur hf we've uncovered before considering an investment in the company.
- Future Earnings: How does OSSR's growth rate compare to its peers and the wider market? Dig deeper into the analyst consensus number for the upcoming years by interacting with our free analyst growth expectation chart.
- Other Solid Businesses: Low debt, high returns on equity and good past performance are fundamental to a strong business. Why not explore our interactive list of stocks with solid business fundamentals to see if there are other companies you may not have considered!
PS. Simply Wall St updates its DCF calculation for every Danish stock every day, so if you want to find the intrinsic value of any other stock just search here.
Valuation is complex, but we're here to simplify it.
Discover if Embla Medical hf might be undervalued or overvalued with our detailed analysis, featuring fair value estimates, potential risks, dividends, insider trades, and its financial condition.
Access Free AnalysisHave feedback on this article? Concerned about the content? Get in touch with us directly. Alternatively, email editorial-team (at) simplywallst.com.
This article by Simply Wall St is general in nature. We provide commentary based on historical data and analyst forecasts only using an unbiased methodology and our articles are not intended to be financial advice. It does not constitute a recommendation to buy or sell any stock, and does not take account of your objectives, or your financial situation. We aim to bring you long-term focused analysis driven by fundamental data. Note that our analysis may not factor in the latest price-sensitive company announcements or qualitative material. Simply Wall St has no position in any stocks mentioned.
About CPSE:EMBLA
Embla Medical hf
Provides non-invasive orthopedic products in Europe, the Middle East, Africa, the Americas, and the Asia-Pacific.
Excellent balance sheet with proven track record.
Similar Companies
Market Insights

Advertisement
Community Narratives
The company that turned a verb into a global necessity and basically runs the modern internet, digital ads, smartphones, maps, and AI.
Fair Value US$300.00|6.2% undervalued
OS
Community Contributor
Flowers Foods Pays A Fair Price For Health
Fair Value US$16.12|26.0% undervalued
NV
Community Contributor
TMX Group will thrive with 33.3% profit margin and enduring market moat
Fair Value CA$49.90|3.7% overvalued
LI
Community Contributor