Stock Analysis
- Germany
- /
- Renewable Energy
- /
- XTRA:RWE
There's Been No Shortage Of Growth Recently For RWE's (ETR:RWE) Returns On Capital
What are the early trends we should look for to identify a stock that could multiply in value over the long term? Firstly, we'll want to see a proven return on capital employed (ROCE) that is increasing, and secondly, an expanding base of capital employed. If you see this, it typically means it's a company with a great business model and plenty of profitable reinvestment opportunities. Speaking of which, we noticed some great changes in RWE's (ETR:RWE) returns on capital, so let's have a look.
What Is Return On Capital Employed (ROCE)?
For those who don't know, ROCE is a measure of a company's yearly pre-tax profit (its return), relative to the capital employed in the business. To calculate this metric for RWE, this is the formula:
Return on Capital Employed = Earnings Before Interest and Tax (EBIT) ÷ (Total Assets - Current Liabilities)
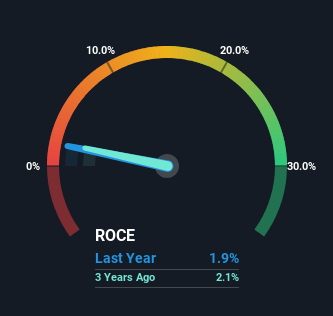
0.019 = €1.3b ÷ (€109b - €39b) (Based on the trailing twelve months to September 2023).
Therefore, RWE has an ROCE of 1.9%. Ultimately, that's a low return and it under-performs the Renewable Energy industry average of 5.7%.
View our latest analysis for RWE
Above you can see how the current ROCE for RWE compares to its prior returns on capital, but there's only so much you can tell from the past. If you'd like, you can check out the forecasts from the analysts covering RWE for free.
The Trend Of ROCE
We're delighted to see that RWE is reaping rewards from its investments and is now generating some pre-tax profits. Shareholders would no doubt be pleased with this because the business was loss-making five years ago but is is now generating 1.9% on its capital. In addition to that, RWE is employing 103% more capital than previously which is expected of a company that's trying to break into profitability. We like this trend, because it tells us the company has profitable reinvestment opportunities available to it, and if it continues going forward that can lead to a multi-bagger performance.
In another part of our analysis, we noticed that the company's ratio of current liabilities to total assets decreased to 36%, which broadly means the business is relying less on its suppliers or short-term creditors to fund its operations. So shareholders would be pleased that the growth in returns has mostly come from underlying business performance.
In Conclusion...
Overall, RWE gets a big tick from us thanks in most part to the fact that it is now profitable and is reinvesting in its business. And with a respectable 42% awarded to those who held the stock over the last five years, you could argue that these developments are starting to get the attention they deserve. Therefore, we think it would be worth your time to check if these trends are going to continue.
One more thing: We've identified 4 warning signs with RWE (at least 2 which are a bit concerning) , and understanding these would certainly be useful.
If you want to search for solid companies with great earnings, check out this free list of companies with good balance sheets and impressive returns on equity.
Valuation is complex, but we're helping make it simple.
Find out whether RWE is potentially over or undervalued by checking out our comprehensive analysis, which includes fair value estimates, risks and warnings, dividends, insider transactions and financial health.
View the Free AnalysisHave feedback on this article? Concerned about the content? Get in touch with us directly. Alternatively, email editorial-team (at) simplywallst.com.
This article by Simply Wall St is general in nature. We provide commentary based on historical data and analyst forecasts only using an unbiased methodology and our articles are not intended to be financial advice. It does not constitute a recommendation to buy or sell any stock, and does not take account of your objectives, or your financial situation. We aim to bring you long-term focused analysis driven by fundamental data. Note that our analysis may not factor in the latest price-sensitive company announcements or qualitative material. Simply Wall St has no position in any stocks mentioned.

Simply Wall St
About XTRA:RWE
RWE
RWE Aktiengesellschaft generates and supplies electricity from renewable and conventional sources in Germany, the United Kingdom, rest of Europe, North America, and internationally.
Excellent balance sheet and fair value.
