- Germany
- /
- Other Utilities
- /
- XTRA:EOAN
Should E.ON SE (ETR:EOAN) Focus On Improving This Fundamental Metric?

One of the best investments we can make is in our own knowledge and skill set. With that in mind, this article will work through how we can use Return On Equity (ROE) to better understand a business. To keep the lesson grounded in practicality, we'll use ROE to better understand E.ON SE (ETR:EOAN).
ROE or return on equity is a useful tool to assess how effectively a company can generate returns on the investment it received from its shareholders. In simpler terms, it measures the profitability of a company in relation to shareholder's equity.
See our latest analysis for E.ON
How Do You Calculate Return On Equity?
Return on equity can be calculated by using the formula:
Return on Equity = Net Profit (from continuing operations) ÷ Shareholders' Equity
So, based on the above formula, the ROE for E.ON is:
8.1% = €1.7b ÷ €21b (Based on the trailing twelve months to March 2024).
The 'return' is the income the business earned over the last year. So, this means that for every €1 of its shareholder's investments, the company generates a profit of €0.08.
Does E.ON Have A Good ROE?
One simple way to determine if a company has a good return on equity is to compare it to the average for its industry. The limitation of this approach is that some companies are quite different from others, even within the same industry classification. As is clear from the image below, E.ON has a lower ROE than the average (12%) in the Integrated Utilities industry.
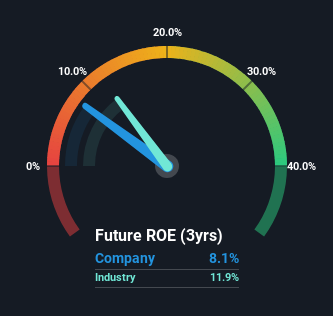
That certainly isn't ideal. That being said, a low ROE is not always a bad thing, especially if the company has low leverage as this still leaves room for improvement if the company were to take on more debt. A high debt company having a low ROE is a different story altogether and a risky investment in our books. To know the 3 risks we have identified for E.ON visit our risks dashboard for free.
The Importance Of Debt To Return On Equity
Companies usually need to invest money to grow their profits. The cash for investment can come from prior year profits (retained earnings), issuing new shares, or borrowing. In the first two cases, the ROE will capture this use of capital to grow. In the latter case, the debt used for growth will improve returns, but won't affect the total equity. That will make the ROE look better than if no debt was used.
Combining E.ON's Debt And Its 8.1% Return On Equity
E.ON does use a high amount of debt to increase returns. It has a debt to equity ratio of 1.80. The combination of a rather low ROE and significant use of debt is not particularly appealing. Debt increases risk and reduces options for the company in the future, so you generally want to see some good returns from using it.
Conclusion
Return on equity is useful for comparing the quality of different businesses. In our books, the highest quality companies have high return on equity, despite low debt. All else being equal, a higher ROE is better.
But ROE is just one piece of a bigger puzzle, since high quality businesses often trade on high multiples of earnings. The rate at which profits are likely to grow, relative to the expectations of profit growth reflected in the current price, must be considered, too. So you might want to take a peek at this data-rich interactive graph of forecasts for the company.
Of course E.ON may not be the best stock to buy. So you may wish to see this free collection of other companies that have high ROE and low debt.
Valuation is complex, but we're here to simplify it.
Discover if E.ON might be undervalued or overvalued with our detailed analysis, featuring fair value estimates, potential risks, dividends, insider trades, and its financial condition.
Access Free AnalysisHave feedback on this article? Concerned about the content? Get in touch with us directly. Alternatively, email editorial-team (at) simplywallst.com.
This article by Simply Wall St is general in nature. We provide commentary based on historical data and analyst forecasts only using an unbiased methodology and our articles are not intended to be financial advice. It does not constitute a recommendation to buy or sell any stock, and does not take account of your objectives, or your financial situation. We aim to bring you long-term focused analysis driven by fundamental data. Note that our analysis may not factor in the latest price-sensitive company announcements or qualitative material. Simply Wall St has no position in any stocks mentioned.
About XTRA:EOAN
E.ON
Operates as an energy company in Germany, the United Kingdom, Sweden, the Netherlands, rest of Europe, and internationally.
Good value with proven track record.
