
Advertisement
Some say volatility, rather than debt, is the best way to think about risk as an investor, but Warren Buffett famously said that 'Volatility is far from synonymous with risk.' When we think about how risky a company is, we always like to look at its use of debt, since debt overload can lead to ruin. We can see that E.ON SE (ETR:EOAN) does use debt in its business. But should shareholders be worried about its use of debt?
Our free stock report includes 3 warning signs investors should be aware of before investing in E.ON. Read for free now.When Is Debt A Problem?
Debt assists a business until the business has trouble paying it off, either with new capital or with free cash flow. If things get really bad, the lenders can take control of the business. However, a more usual (but still expensive) situation is where a company must dilute shareholders at a cheap share price simply to get debt under control. By replacing dilution, though, debt can be an extremely good tool for businesses that need capital to invest in growth at high rates of return. When we think about a company's use of debt, we first look at cash and debt together.
What Is E.ON's Net Debt?
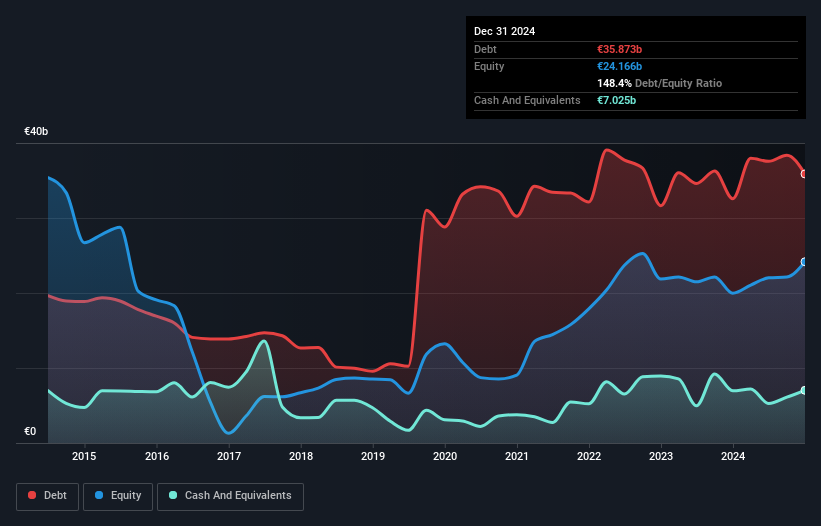
The image below, which you can click on for greater detail, shows that at December 2024 E.ON had debt of €35.9b, up from €32.6b in one year. However, because it has a cash reserve of €7.03b, its net debt is less, at about €28.8b.
How Healthy Is E.ON's Balance Sheet?
Zooming in on the latest balance sheet data, we can see that E.ON had liabilities of €30.0b due within 12 months and liabilities of €57.2b due beyond that. On the other hand, it had cash of €7.03b and €11.5b worth of receivables due within a year. So its liabilities total €68.7b more than the combination of its cash and short-term receivables.
This deficit casts a shadow over the €39.3b company, like a colossus towering over mere mortals. So we definitely think shareholders need to watch this one closely. After all, E.ON would likely require a major re-capitalisation if it had to pay its creditors today.
Check out our latest analysis for E.ON
We use two main ratios to inform us about debt levels relative to earnings. The first is net debt divided by earnings before interest, tax, depreciation, and amortization (EBITDA), while the second is how many times its earnings before interest and tax (EBIT) covers its interest expense (or its interest cover, for short). The advantage of this approach is that we take into account both the absolute quantum of debt (with net debt to EBITDA) and the actual interest expenses associated with that debt (with its interest cover ratio).
E.ON's net debt of 2.4 times EBITDA suggests graceful use of debt. And the alluring interest cover (EBIT of 8.7 times interest expense) certainly does not do anything to dispel this impression. Pleasingly, E.ON is growing its EBIT faster than former Australian PM Bob Hawke downs a yard glass, boasting a 848% gain in the last twelve months. When analysing debt levels, the balance sheet is the obvious place to start. But it is future earnings, more than anything, that will determine E.ON's ability to maintain a healthy balance sheet going forward. So if you want to see what the professionals think, you might find this free report on analyst profit forecasts to be interesting.
Finally, a company can only pay off debt with cold hard cash, not accounting profits. So we always check how much of that EBIT is translated into free cash flow. Considering the last two years, E.ON actually recorded a cash outflow, overall. Debt is usually more expensive, and almost always more risky in the hands of a company with negative free cash flow. Shareholders ought to hope for an improvement.
Our View
On the face of it, E.ON's conversion of EBIT to free cash flow left us tentative about the stock, and its level of total liabilities was no more enticing than the one empty restaurant on the busiest night of the year. But at least it's pretty decent at growing its EBIT; that's encouraging. We should also note that Integrated Utilities industry companies like E.ON commonly do use debt without problems. Once we consider all the factors above, together, it seems to us that E.ON's debt is making it a bit risky. That's not necessarily a bad thing, but we'd generally feel more comfortable with less leverage. When analysing debt levels, the balance sheet is the obvious place to start. However, not all investment risk resides within the balance sheet - far from it. Case in point: We've spotted 3 warning signs for E.ON you should be aware of, and 2 of them are a bit unpleasant.
If, after all that, you're more interested in a fast growing company with a rock-solid balance sheet, then check out our list of net cash growth stocks without delay.
Valuation is complex, but we're here to simplify it.
Discover if E.ON might be undervalued or overvalued with our detailed analysis, featuring fair value estimates, potential risks, dividends, insider trades, and its financial condition.
Access Free AnalysisHave feedback on this article? Concerned about the content? Get in touch with us directly. Alternatively, email editorial-team (at) simplywallst.com.
This article by Simply Wall St is general in nature. We provide commentary based on historical data and analyst forecasts only using an unbiased methodology and our articles are not intended to be financial advice. It does not constitute a recommendation to buy or sell any stock, and does not take account of your objectives, or your financial situation. We aim to bring you long-term focused analysis driven by fundamental data. Note that our analysis may not factor in the latest price-sensitive company announcements or qualitative material. Simply Wall St has no position in any stocks mentioned.
About XTRA:EOAN
E.ON
Operates as an energy company in Germany, the United Kingdom, Sweden, the Netherlands, rest of Europe, and internationally.
Proven track record second-rate dividend payer.
Similar Companies
Market Insights

Advertisement
Community Narratives
MicroVision will explode future revenue by 380.37% with a vision towards success
Fair Value US$60.00|98.4% undervalued
TH
Community Contributor
The Indispensable Artery for a New North American Economy
Fair Value CA$132.87|1.3% undervalued
TI
Community Contributor