
Advertisement
Novabase S.G.P.S., S.A.'s (FRA:NVQ) Has Been On A Rise But Financial Prospects Look Weak: Is The Stock Overpriced?
Most readers would already be aware that Novabase S.G.P.S' (FRA:NVQ) stock increased significantly by 24% over the past three months. However, in this article, we decided to focus on its weak fundamentals, as long-term financial performance of a business is what ultimately dictates market outcomes. In this article, we decided to focus on Novabase S.G.P.S' ROE.
Return on Equity or ROE is a test of how effectively a company is growing its value and managing investors’ money. Simply put, it is used to assess the profitability of a company in relation to its equity capital.
See our latest analysis for Novabase S.G.P.S
How Is ROE Calculated?
The formula for ROE is:
Return on Equity = Net Profit (from continuing operations) ÷ Shareholders' Equity
So, based on the above formula, the ROE for Novabase S.G.P.S is:
7.8% = €6.6m ÷ €85m (Based on the trailing twelve months to December 2024).
The 'return' refers to a company's earnings over the last year. That means that for every €1 worth of shareholders' equity, the company generated €0.08 in profit.
What Has ROE Got To Do With Earnings Growth?
So far, we've learned that ROE is a measure of a company's profitability. Depending on how much of these profits the company reinvests or "retains", and how effectively it does so, we are then able to assess a company’s earnings growth potential. Assuming everything else remains unchanged, the higher the ROE and profit retention, the higher the growth rate of a company compared to companies that don't necessarily bear these characteristics.
A Side By Side comparison of Novabase S.G.P.S' Earnings Growth And 7.8% ROE
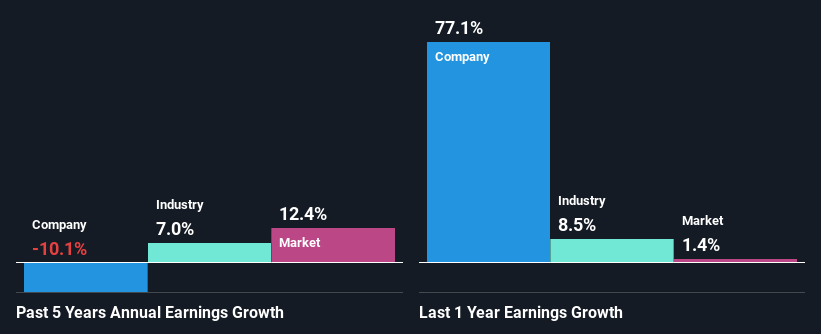
On the face of it, Novabase S.G.P.S' ROE is not much to talk about. Next, when compared to the average industry ROE of 11%, the company's ROE leaves us feeling even less enthusiastic. Given the circumstances, the significant decline in net income by 10% seen by Novabase S.G.P.S over the last five years is not surprising. We believe that there also might be other aspects that are negatively influencing the company's earnings prospects. For instance, the company has a very high payout ratio, or is faced with competitive pressures.
However, when we compared Novabase S.G.P.S' growth with the industry we found that while the company's earnings have been shrinking, the industry has seen an earnings growth of 7.0% in the same period. This is quite worrisome.
The basis for attaching value to a company is, to a great extent, tied to its earnings growth. What investors need to determine next is if the expected earnings growth, or the lack of it, is already built into the share price. Doing so will help them establish if the stock's future looks promising or ominous. One good indicator of expected earnings growth is the P/E ratio which determines the price the market is willing to pay for a stock based on its earnings prospects. So, you may want to check if Novabase S.G.P.S is trading on a high P/E or a low P/E, relative to its industry.
Is Novabase S.G.P.S Efficiently Re-investing Its Profits?
Novabase S.G.P.S' high three-year median payout ratio of 549% suggests that the company is depleting its resources to keep up its dividend payments, and this shows in its shrinking earnings. Its usually very hard to sustain dividend payments that are higher than reported profits. Our risks dashboard should have the 3 risks we have identified for Novabase S.G.P.S.
Additionally, Novabase S.G.P.S has paid dividends over a period of at least ten years, which means that the company's management is determined to pay dividends even if it means little to no earnings growth.
Summary
Overall, we would be extremely cautious before making any decision on Novabase S.G.P.S. The low ROE, combined with the fact that the company is paying out almost if not all, of its profits as dividends, has resulted in the lack or absence of growth in its earnings. Until now, we have only just grazed the surface of the company's past performance by looking at the company's fundamentals. So it may be worth checking this free detailed graph of Novabase S.G.P.S' past earnings, as well as revenue and cash flows to get a deeper insight into the company's performance.
Valuation is complex, but we're here to simplify it.
Discover if Novabase S.G.P.S might be undervalued or overvalued with our detailed analysis, featuring fair value estimates, potential risks, dividends, insider trades, and its financial condition.
Access Free AnalysisHave feedback on this article? Concerned about the content? Get in touch with us directly. Alternatively, email editorial-team (at) simplywallst.com.
This article by Simply Wall St is general in nature. We provide commentary based on historical data and analyst forecasts only using an unbiased methodology and our articles are not intended to be financial advice. It does not constitute a recommendation to buy or sell any stock, and does not take account of your objectives, or your financial situation. We aim to bring you long-term focused analysis driven by fundamental data. Note that our analysis may not factor in the latest price-sensitive company announcements or qualitative material. Simply Wall St has no position in any stocks mentioned.
About DB:NVQ
Novabase S.G.P.S
Through its subsidiaries, provides IT consulting and services in Portugal, rest of Europe, Africa, the Middle East, and internationally.
Excellent balance sheet with acceptable track record.
Market Insights

Advertisement
Community Narratives
The company that turned a verb into a global necessity and basically runs the modern internet, digital ads, smartphones, maps, and AI.
Fair Value US$300.00|5.2% undervalued
OS
Community Contributor
Flowers Foods Pays A Fair Price For Health
Fair Value US$16.12|24.9% undervalued
NV
Community Contributor
TMX Group will thrive with 33.3% profit margin and enduring market moat
Fair Value CA$49.90|3.3% overvalued
LI
Community Contributor
The "Molecular Pencil": Why Beam's Technology is Built to Win
Fair Value US$65.01|64.5% undervalued
DA
Community Contributor