Advertisement
PSI Software (XTRA:PSAN) Losses Worsen, Testing Bullish Profitability Narrative Ahead of Projected Turnaround

Simply Wall St
Reviewed by Simply Wall St
PSI Software (XTRA:PSAN) remains unprofitable, with losses increasing at an annual rate of 57.1% over the last five years. Despite ongoing negative net margins, the company’s top line paints a different story. Revenues are forecast to jump 9.6% per year, outpacing the German market, and earnings are projected to expand at 54.62% per year with a return to profitability expected within three years. Investors eye these growth forecasts as well as the company’s valuation, which currently sits just below its fair value estimate. This creates a nuanced outlook that balances recent losses with strong upside potential.
See our full analysis for PSI Software.The next section dives into how these earnings figures stack up against the key narratives debated by analysts and the investor community. Some themes could be challenged, while others might get reinforced.
Curious how numbers become stories that shape markets? Explore Community Narratives
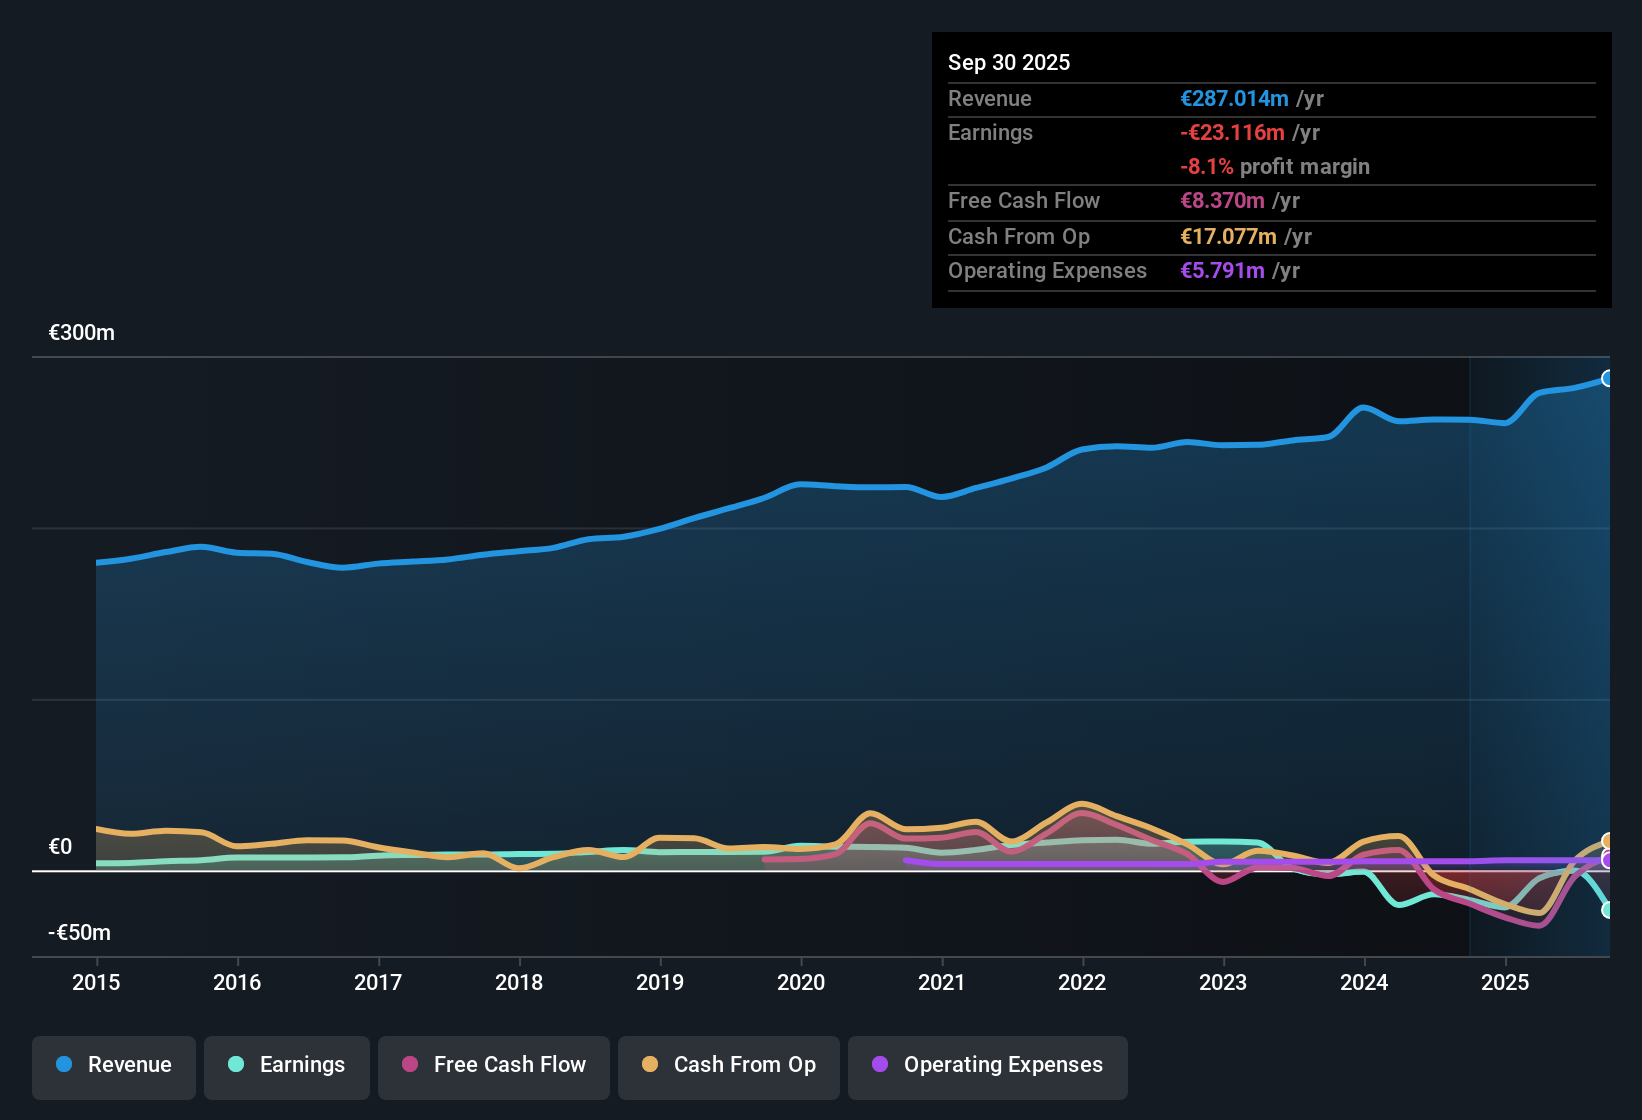
Net Margin Weakness Persists
- The company’s net profit margin has not improved, staying in negative territory even as losses widened at a rate of 57.1% annually over the past five years.
- Forecasts for a return to profitability within three years heavily rely on trends that outpace the wider market:
- Recurring annual revenue growth of 9.6% now outstrips the German average of 6.1%, drawing attention to PSI’s potential to flip margins positive if growth stays on course.
- The expectation of a 54.62% per year earnings expansion underpins optimism that persistent margin drag will be temporary, though ongoing losses temper the bullish narrative.
Share Price Below DCF Fair Value
- PSI shares currently trade at €45.10, just under the latest DCF fair value estimate of €45.89, raising debates about whether the stock is modestly undervalued or accurately priced for risk.
- What’s notable is that this small discount exists even as losses remain elevated:
- This suggests investors may be focusing less on past unprofitability and more on forward growth prospects when assigning value.
- Industry comparisons show PSI is pricier than the sector on price-to-sales (2.5x vs sector’s 2.2x), yet more attractive than direct peers (2.5x vs peer average of 5.6x).
Volatile Share Performance Offsets Upside
- Recent share price instability over the past three months stands out as the key risk, even as forecasts support strong profit and revenue gains ahead.
- Prevailing market view highlights both sides of this tension:
- The reward outlook is buoyed by growth rates that comfortably beat the market and the sector’s broader digitalization trends continuing to generate opportunity.
- However, volatility signals investor caution and keeps valuation closely tethered to visible execution in the next periods rather than pure optimism.
- Curious how numbers become stories that shape markets? Curious how numbers become stories that shape markets? Explore Community Narratives
Next Steps
Don't just look at this quarter; the real story is in the long-term trend. We've done an in-depth analysis on PSI Software's growth and its valuation to see if today's price is a bargain. Add the company to your watchlist or portfolio now so you don't miss the next big move.
See What Else Is Out There
PSI Software’s persistent net losses, volatile share performance, and negative margins highlight its struggle for consistency, even as analysts provide promising growth forecasts.
If you want steadier options, use our stable growth stocks screener (2103 results) to focus on companies that deliver reliable revenue and earnings expansion year after year.
This article by Simply Wall St is general in nature. We provide commentary based on historical data and analyst forecasts only using an unbiased methodology and our articles are not intended to be financial advice. It does not constitute a recommendation to buy or sell any stock, and does not take account of your objectives, or your financial situation. We aim to bring you long-term focused analysis driven by fundamental data. Note that our analysis may not factor in the latest price-sensitive company announcements or qualitative material. Simply Wall St has no position in any stocks mentioned.
New: Manage All Your Stock Portfolios in One Place
We've created the ultimate portfolio companion for stock investors, and it's free.
• Connect an unlimited number of Portfolios and see your total in one currency
• Be alerted to new Warning Signs or Risks via email or mobile
• Track the Fair Value of your stocks
Have feedback on this article? Concerned about the content? Get in touch with us directly. Alternatively, email editorial-team@simplywallst.com
About XTRA:PSAN
PSI Software
Develops and integrates software solutions and products for optimizing the flow of energy and materials for utilities and industry worldwide.
Reasonable growth potential with adequate balance sheet.
Market Insights

Advertisement
Community Narratives
The company that turned a verb into a global necessity and basically runs the modern internet, digital ads, smartphones, maps, and AI.
Fair Value US$300.00|6.3% undervalued
OS
Community Contributor
Flowers Foods Pays A Fair Price For Health
Fair Value US$16.12|26.0% undervalued
NV
Community Contributor
TMX Group will thrive with 33.3% profit margin and enduring market moat
Fair Value CA$49.90|3.7% overvalued
LI
Community Contributor