Individual investors invested in GFT Technologies SE (ETR:GFT) copped the brunt of last week's €68m market cap decline


Key Insights
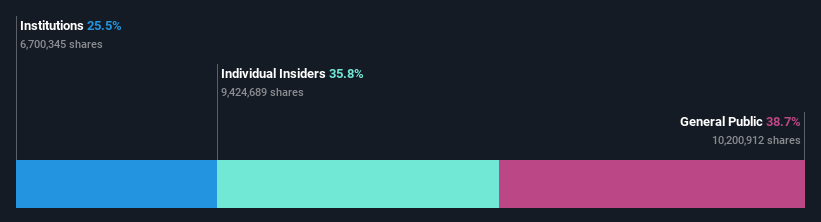
- The considerable ownership by individual investors in GFT Technologies indicates that they collectively have a greater say in management and business strategy
- 51% of the business is held by the top 8 shareholders
- 36% of GFT Technologies is held by insiders
Every investor in GFT Technologies SE (ETR:GFT) should be aware of the most powerful shareholder groups. With 39% stake, individual investors possess the maximum shares in the company. That is, the group stands to benefit the most if the stock rises (or lose the most if there is a downturn).
Following a 7.9% decrease in the stock price last week, individual investors suffered the most losses, but insiders who own 36% stock also took a hit.
Let's take a closer look to see what the different types of shareholders can tell us about GFT Technologies.
See our latest analysis for GFT Technologies
What Does The Institutional Ownership Tell Us About GFT Technologies?
Many institutions measure their performance against an index that approximates the local market. So they usually pay more attention to companies that are included in major indices.
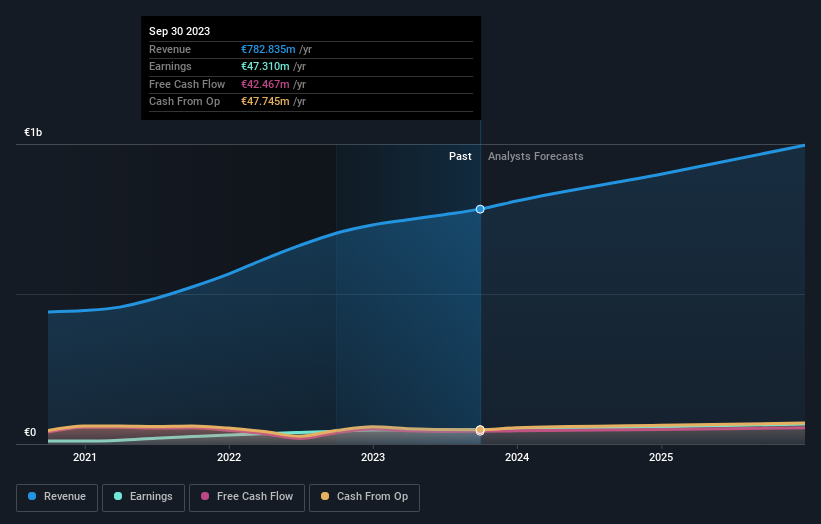
As you can see, institutional investors have a fair amount of stake in GFT Technologies. This implies the analysts working for those institutions have looked at the stock and they like it. But just like anyone else, they could be wrong. If multiple institutions change their view on a stock at the same time, you could see the share price drop fast. It's therefore worth looking at GFT Technologies' earnings history below. Of course, the future is what really matters.
Hedge funds don't have many shares in GFT Technologies. Our data suggests that Ulrich Dietz, who is also the company's Top Key Executive, holds the most number of shares at 26%. When an insider holds a sizeable amount of a company's stock, investors consider it as a positive sign because it suggests that insiders are willing to have their wealth tied up in the future of the company. Meanwhile, the second and third largest shareholders, hold 9.5% and 5.0%, of the shares outstanding, respectively.
On further inspection, we found that more than half the company's shares are owned by the top 8 shareholders, suggesting that the interests of the larger shareholders are balanced out to an extent by the smaller ones.
Researching institutional ownership is a good way to gauge and filter a stock's expected performance. The same can be achieved by studying analyst sentiments. Quite a few analysts cover the stock, so you could look into forecast growth quite easily.
Insider Ownership Of GFT Technologies
While the precise definition of an insider can be subjective, almost everyone considers board members to be insiders. Management ultimately answers to the board. However, it is not uncommon for managers to be executive board members, especially if they are a founder or the CEO.
Most consider insider ownership a positive because it can indicate the board is well aligned with other shareholders. However, on some occasions too much power is concentrated within this group.
It seems insiders own a significant proportion of GFT Technologies SE. It has a market capitalization of just €792m, and insiders have €283m worth of shares in their own names. It is great to see insiders so invested in the business. It might be worth checking if those insiders have been buying recently.
General Public Ownership
The general public, who are usually individual investors, hold a 39% stake in GFT Technologies. This size of ownership, while considerable, may not be enough to change company policy if the decision is not in sync with other large shareholders.
Next Steps:
While it is well worth considering the different groups that own a company, there are other factors that are even more important.
I always like to check for a history of revenue growth. You can too, by accessing this free chart of historic revenue and earnings in this detailed graph.
If you would prefer discover what analysts are predicting in terms of future growth, do not miss this free report on analyst forecasts.
NB: Figures in this article are calculated using data from the last twelve months, which refer to the 12-month period ending on the last date of the month the financial statement is dated. This may not be consistent with full year annual report figures.
New: Manage All Your Stock Portfolios in One Place
We've created the ultimate portfolio companion for stock investors, and it's free.
• Connect an unlimited number of Portfolios and see your total in one currency
• Be alerted to new Warning Signs or Risks via email or mobile
• Track the Fair Value of your stocks
Have feedback on this article? Concerned about the content? Get in touch with us directly. Alternatively, email editorial-team (at) simplywallst.com.
This article by Simply Wall St is general in nature. We provide commentary based on historical data and analyst forecasts only using an unbiased methodology and our articles are not intended to be financial advice. It does not constitute a recommendation to buy or sell any stock, and does not take account of your objectives, or your financial situation. We aim to bring you long-term focused analysis driven by fundamental data. Note that our analysis may not factor in the latest price-sensitive company announcements or qualitative material. Simply Wall St has no position in any stocks mentioned.
About XTRA:GFT
Flawless balance sheet, undervalued and pays a dividend.

