Stock Analysis
What Type Of Returns Would Berentzen-Gruppe's(ETR:BEZ) Shareholders Have Earned If They Purchased Their SharesThree Years Ago?


As an investor its worth striving to ensure your overall portfolio beats the market average. But if you try your hand at stock picking, your risk returning less than the market. We regret to report that long term Berentzen-Gruppe Aktiengesellschaft (ETR:BEZ) shareholders have had that experience, with the share price dropping 29% in three years, versus a market decline of about 6.0%. On the other hand the share price has bounced 5.4% over the last week. The buoyant market could have helped drive the share price pop, since stocks are up 2.2% in the same period.
Check out our latest analysis for Berentzen-Gruppe
There is no denying that markets are sometimes efficient, but prices do not always reflect underlying business performance. One way to examine how market sentiment has changed over time is to look at the interaction between a company's share price and its earnings per share (EPS).
During the three years that the share price fell, Berentzen-Gruppe's earnings per share (EPS) dropped by 18% each year. This fall in the EPS is worse than the 11% compound annual share price fall. So the market may not be too worried about the EPS figure, at the moment -- or it may have previously priced some of the drop in.
The company's earnings per share (over time) is depicted in the image below (click to see the exact numbers).
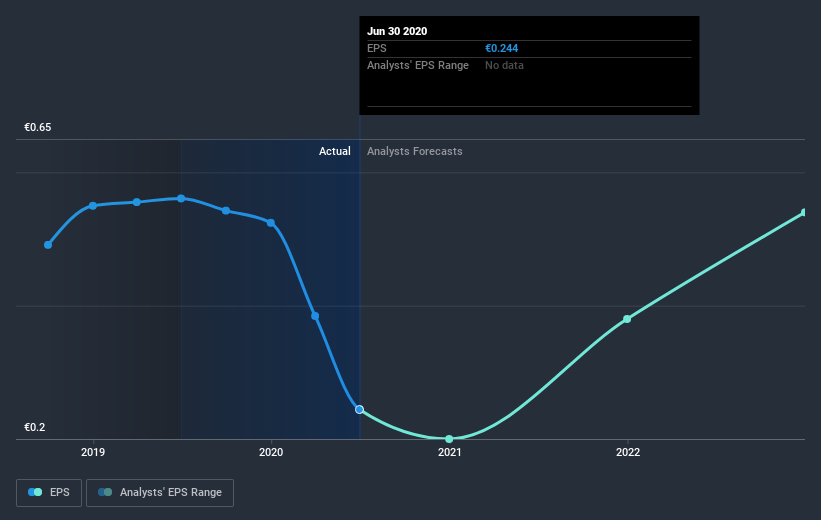
This free interactive report on Berentzen-Gruppe's earnings, revenue and cash flow is a great place to start, if you want to investigate the stock further.
What About Dividends?
When looking at investment returns, it is important to consider the difference between total shareholder return (TSR) and share price return. The TSR incorporates the value of any spin-offs or discounted capital raisings, along with any dividends, based on the assumption that the dividends are reinvested. Arguably, the TSR gives a more comprehensive picture of the return generated by a stock. In the case of Berentzen-Gruppe, it has a TSR of -20% for the last 3 years. That exceeds its share price return that we previously mentioned. The dividends paid by the company have thusly boosted the total shareholder return.
A Different Perspective
Investors in Berentzen-Gruppe had a tough year, with a total loss of 13% (including dividends), against a market gain of about 6.6%. Even the share prices of good stocks drop sometimes, but we want to see improvements in the fundamental metrics of a business, before getting too interested. Regrettably, last year's performance caps off a bad run, with the shareholders facing a total loss of 0.8% per year over five years. Generally speaking long term share price weakness can be a bad sign, though contrarian investors might want to research the stock in hope of a turnaround. It's always interesting to track share price performance over the longer term. But to understand Berentzen-Gruppe better, we need to consider many other factors. Consider risks, for instance. Every company has them, and we've spotted 3 warning signs for Berentzen-Gruppe you should know about.
If you like to buy stocks alongside management, then you might just love this free list of companies. (Hint: insiders have been buying them).
Please note, the market returns quoted in this article reflect the market weighted average returns of stocks that currently trade on DE exchanges.
If you’re looking to trade Berentzen-Gruppe, open an account with the lowest-cost* platform trusted by professionals, Interactive Brokers. Their clients from over 200 countries and territories trade stocks, options, futures, forex, bonds and funds worldwide from a single integrated account. Promoted
Valuation is complex, but we're helping make it simple.
Find out whether Berentzen-Gruppe is potentially over or undervalued by checking out our comprehensive analysis, which includes fair value estimates, risks and warnings, dividends, insider transactions and financial health.
View the Free AnalysisThis article by Simply Wall St is general in nature. It does not constitute a recommendation to buy or sell any stock, and does not take account of your objectives, or your financial situation. We aim to bring you long-term focused analysis driven by fundamental data. Note that our analysis may not factor in the latest price-sensitive company announcements or qualitative material. Simply Wall St has no position in any stocks mentioned.
*Interactive Brokers Rated Lowest Cost Broker by StockBrokers.com Annual Online Review 2020
Have feedback on this article? Concerned about the content? Get in touch with us directly. Alternatively, email editorial-team (at) simplywallst.com.
About XTRA:BEZ
Berentzen-Gruppe
Produces and distributes spirits and non-alcoholic beverages in Germany, rest of Europe Union, rest of Europe, and internationally.
Moderate growth potential with mediocre balance sheet.
