Stock Analysis
There's Been No Shortage Of Growth Recently For STS Group's (ETR:SF3) Returns On Capital


Finding a business that has the potential to grow substantially is not easy, but it is possible if we look at a few key financial metrics. Typically, we'll want to notice a trend of growing return on capital employed (ROCE) and alongside that, an expanding base of capital employed. This shows us that it's a compounding machine, able to continually reinvest its earnings back into the business and generate higher returns. With that in mind, we've noticed some promising trends at STS Group (ETR:SF3) so let's look a bit deeper.
Understanding Return On Capital Employed (ROCE)
For those that aren't sure what ROCE is, it measures the amount of pre-tax profits a company can generate from the capital employed in its business. Analysts use this formula to calculate it for STS Group:
Return on Capital Employed = Earnings Before Interest and Tax (EBIT) ÷ (Total Assets - Current Liabilities)
0.0049 = €500k ÷ (€231m - €130m) (Based on the trailing twelve months to June 2023).
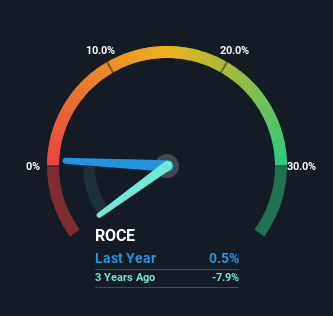
Thus, STS Group has an ROCE of 0.5%. In absolute terms, that's a low return and it also under-performs the Machinery industry average of 11%.
See our latest analysis for STS Group
Above you can see how the current ROCE for STS Group compares to its prior returns on capital, but there's only so much you can tell from the past. If you'd like, you can check out the forecasts from the analysts covering STS Group here for free.
What The Trend Of ROCE Can Tell Us
We're delighted to see that STS Group is reaping rewards from its investments and has now broken into profitability. Historically the company was generating losses but as we can see from the latest figures referenced above, they're now earning 0.5% on their capital employed. Additionally, the business is utilizing 21% less capital than it was five years ago, and taken at face value, that can mean the company needs less funds at work to get a return. The reduction could indicate that the company is selling some assets, and considering returns are up, they appear to be selling the right ones.
Another thing to note, STS Group has a high ratio of current liabilities to total assets of 56%. This can bring about some risks because the company is basically operating with a rather large reliance on its suppliers or other sorts of short-term creditors. Ideally we'd like to see this reduce as that would mean fewer obligations bearing risks.
The Bottom Line
In summary, it's great to see that STS Group has been able to turn things around and earn higher returns on lower amounts of capital. And since the stock has dived 78% over the last five years, there may be other factors affecting the company's prospects. In any case, we believe the economic trends of this company are positive and looking into the stock further could prove rewarding.
One more thing to note, we've identified 1 warning sign with STS Group and understanding this should be part of your investment process.
While STS Group may not currently earn the highest returns, we've compiled a list of companies that currently earn more than 25% return on equity. Check out this free list here.
Valuation is complex, but we're helping make it simple.
Find out whether STS Group is potentially over or undervalued by checking out our comprehensive analysis, which includes fair value estimates, risks and warnings, dividends, insider transactions and financial health.
View the Free AnalysisHave feedback on this article? Concerned about the content? Get in touch with us directly. Alternatively, email editorial-team (at) simplywallst.com.
This article by Simply Wall St is general in nature. We provide commentary based on historical data and analyst forecasts only using an unbiased methodology and our articles are not intended to be financial advice. It does not constitute a recommendation to buy or sell any stock, and does not take account of your objectives, or your financial situation. We aim to bring you long-term focused analysis driven by fundamental data. Note that our analysis may not factor in the latest price-sensitive company announcements or qualitative material. Simply Wall St has no position in any stocks mentioned.
About XTRA:SF3
STS Group
A supplier of components and systems for the commercial vehicle and automotive industry primarily in Germany, France, Mexico, and China.
Flawless balance sheet and undervalued.
