Stock Analysis
- Czech Republic
- /
- Electric Utilities
- /
- SEP:CEZ
CEZ, a. s. (SEP:CEZ) Stock's Been Sliding But Fundamentals Look Decent: Will The Market Correct The Share Price In The Future?


With its stock down 7.2% over the past three months, it is easy to disregard CEZ a. s (SEP:CEZ). However, the company's fundamentals look pretty decent, and long-term financials are usually aligned with future market price movements. Specifically, we decided to study CEZ a. s' ROE in this article.
Return on Equity or ROE is a test of how effectively a company is growing its value and managing investors’ money. Put another way, it reveals the company's success at turning shareholder investments into profits.
Check out our latest analysis for CEZ a. s
How To Calculate Return On Equity?
Return on equity can be calculated by using the formula:
Return on Equity = Net Profit (from continuing operations) ÷ Shareholders' Equity
So, based on the above formula, the ROE for CEZ a. s is:
12% = Kč30b ÷ Kč246b (Based on the trailing twelve months to December 2023).
The 'return' refers to a company's earnings over the last year. Another way to think of that is that for every CZK1 worth of equity, the company was able to earn CZK0.12 in profit.
What Has ROE Got To Do With Earnings Growth?
We have already established that ROE serves as an efficient profit-generating gauge for a company's future earnings. We now need to evaluate how much profit the company reinvests or "retains" for future growth which then gives us an idea about the growth potential of the company. Assuming everything else remains unchanged, the higher the ROE and profit retention, the higher the growth rate of a company compared to companies that don't necessarily bear these characteristics.
CEZ a. s' Earnings Growth And 12% ROE
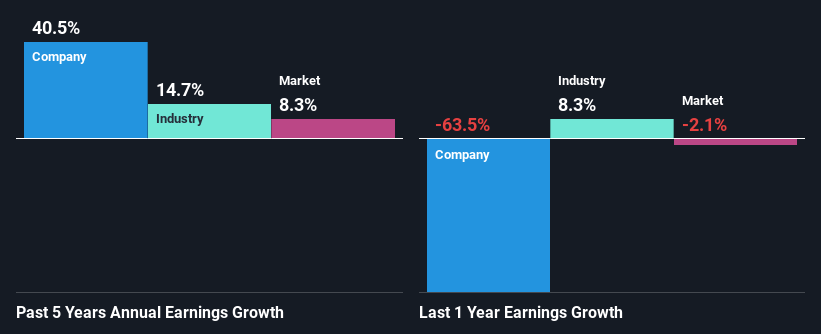
To begin with, CEZ a. s seems to have a respectable ROE. Even when compared to the industry average of 10% the company's ROE looks quite decent. This certainly adds some context to CEZ a. s' exceptional 41% net income growth seen over the past five years. We reckon that there could also be other factors at play here. For example, it is possible that the company's management has made some good strategic decisions, or that the company has a low payout ratio.
Next, on comparing with the industry net income growth, we found that CEZ a. s' growth is quite high when compared to the industry average growth of 15% in the same period, which is great to see.
Earnings growth is an important metric to consider when valuing a stock. What investors need to determine next is if the expected earnings growth, or the lack of it, is already built into the share price. This then helps them determine if the stock is placed for a bright or bleak future. Is CEZ fairly valued? This infographic on the company's intrinsic value has everything you need to know.
Is CEZ a. s Making Efficient Use Of Its Profits?
The really high three-year median payout ratio of 104% for CEZ a. s suggests that the company is paying its shareholders more than what it is earning. However, this hasn't hampered its ability to grow as we saw earlier. Although, it could be worth keeping an eye on the high payout ratio as that's a huge risk. To know the 4 risks we have identified for CEZ a. s visit our risks dashboard for free.
Moreover, CEZ a. s is determined to keep sharing its profits with shareholders which we infer from its long history of paying a dividend for at least ten years. Based on the latest analysts' estimates, we found that the company's future payout ratio over the next three years is expected to hold steady at 87%. Accordingly, forecasts suggest that CEZ a. s' future ROE will be 12% which is again, similar to the current ROE.
Conclusion
On the whole, we do feel that CEZ a. s has some positive attributes. Specifically, its high ROE which likely led to the growth in earnings. Bear in mind, the company reinvests little to none of its profits, which means that investors aren't necessarily reaping the full benefits of the high rate of return. That being so, according to the latest industry analyst forecasts, the company's earnings are expected to shrink in the future. To know more about the latest analysts predictions for the company, check out this visualization of analyst forecasts for the company.
Valuation is complex, but we're helping make it simple.
Find out whether CEZ a. s is potentially over or undervalued by checking out our comprehensive analysis, which includes fair value estimates, risks and warnings, dividends, insider transactions and financial health.
View the Free AnalysisHave feedback on this article? Concerned about the content? Get in touch with us directly. Alternatively, email editorial-team (at) simplywallst.com.
This article by Simply Wall St is general in nature. We provide commentary based on historical data and analyst forecasts only using an unbiased methodology and our articles are not intended to be financial advice. It does not constitute a recommendation to buy or sell any stock, and does not take account of your objectives, or your financial situation. We aim to bring you long-term focused analysis driven by fundamental data. Note that our analysis may not factor in the latest price-sensitive company announcements or qualitative material. Simply Wall St has no position in any stocks mentioned.
About SEP:CEZ
CEZ a. s
CEZ, a. s. engages in the generation, distribution, trade, and sale of electricity and heat in Western, Central, and Southeastern Europe.
Average dividend payer and fair value.
