Stock Analysis
- Czech Republic
- /
- Electric Utilities
- /
- SEP:CEZ
CEZ a. s (SEP:CEZ) stock performs better than its underlying earnings growth over last three years


By buying an index fund, you can roughly match the market return with ease. But if you pick the right individual stocks, you could make more than that. Just take a look at CEZ, a. s. (SEP:CEZ), which is up 64%, over three years, soundly beating the market return of 43% (not including dividends). On the other hand, the returns haven't been quite so good recently, with shareholders up just 0.8% , including dividends .
Since the stock has added Kč28b to its market cap in the past week alone, let's see if underlying performance has been driving long-term returns.
Check out our latest analysis for CEZ a. s
To paraphrase Benjamin Graham: Over the short term the market is a voting machine, but over the long term it's a weighing machine. One way to examine how market sentiment has changed over time is to look at the interaction between a company's share price and its earnings per share (EPS).
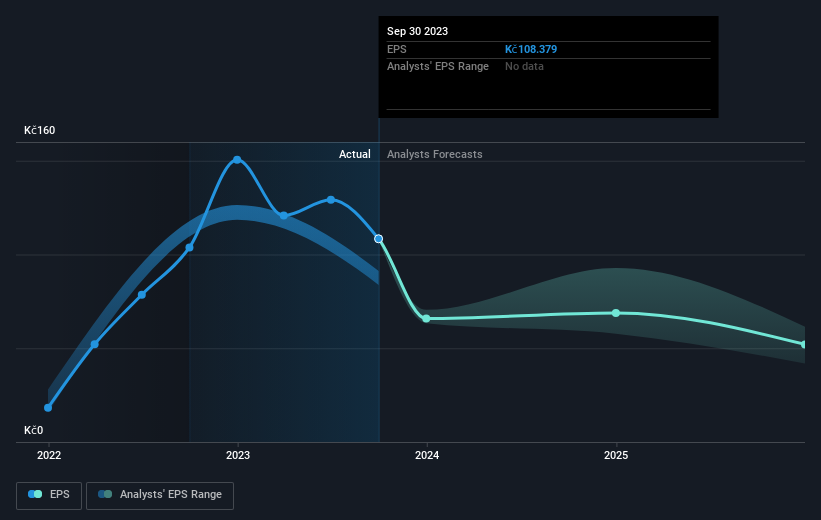
CEZ a. s was able to grow its EPS at 60% per year over three years, sending the share price higher. The average annual share price increase of 18% is actually lower than the EPS growth. Therefore, it seems the market has moderated its expectations for growth, somewhat. We'd venture the lowish P/E ratio of 8.25 also reflects the negative sentiment around the stock.
The image below shows how EPS has tracked over time (if you click on the image you can see greater detail).
It is of course excellent to see how CEZ a. s has grown profits over the years, but the future is more important for shareholders. It might be well worthwhile taking a look at our free report on how its financial position has changed over time.
What About Dividends?
When looking at investment returns, it is important to consider the difference between total shareholder return (TSR) and share price return. Whereas the share price return only reflects the change in the share price, the TSR includes the value of dividends (assuming they were reinvested) and the benefit of any discounted capital raising or spin-off. It's fair to say that the TSR gives a more complete picture for stocks that pay a dividend. As it happens, CEZ a. s' TSR for the last 3 years was 118%, which exceeds the share price return mentioned earlier. This is largely a result of its dividend payments!
A Different Perspective
CEZ a. s shareholders are up 0.8% for the year (even including dividends). But that return falls short of the market. On the bright side, the longer term returns (running at about 20% a year, over half a decade) look better. Maybe the share price is just taking a breather while the business executes on its growth strategy. While it is well worth considering the different impacts that market conditions can have on the share price, there are other factors that are even more important. Case in point: We've spotted 3 warning signs for CEZ a. s you should be aware of, and 1 of them is a bit concerning.
We will like CEZ a. s better if we see some big insider buys. While we wait, check out this free list of growing companies with considerable, recent, insider buying.
Please note, the market returns quoted in this article reflect the market weighted average returns of stocks that currently trade on Czech exchanges.
Valuation is complex, but we're helping make it simple.
Find out whether CEZ a. s is potentially over or undervalued by checking out our comprehensive analysis, which includes fair value estimates, risks and warnings, dividends, insider transactions and financial health.
View the Free AnalysisHave feedback on this article? Concerned about the content? Get in touch with us directly. Alternatively, email editorial-team (at) simplywallst.com.
This article by Simply Wall St is general in nature. We provide commentary based on historical data and analyst forecasts only using an unbiased methodology and our articles are not intended to be financial advice. It does not constitute a recommendation to buy or sell any stock, and does not take account of your objectives, or your financial situation. We aim to bring you long-term focused analysis driven by fundamental data. Note that our analysis may not factor in the latest price-sensitive company announcements or qualitative material. Simply Wall St has no position in any stocks mentioned.
About SEP:CEZ
CEZ a. s
CEZ, a. s. engages in the generation, distribution, trade, and sale of electricity and heat in Western, Central, and Southeastern Europe.
Average dividend payer and fair value.
