- China
- /
- Renewable Energy
- /
- SZSE:000875
The total return for Jilin Electric PowerLtd (SZSE:000875) investors has risen faster than earnings growth over the last five years

It hasn't been the best quarter for Jilin Electric Power Co.,Ltd. (SZSE:000875) shareholders, since the share price has fallen 16% in that time. Looking further back, the stock has generated good profits over five years. After all, the share price is up a market-beating 61% in that time. While the returns over the last 5 years have been good, we do feel sorry for those shareholders who haven't held shares that long, because the share price is down 31% in the last three years.
Although Jilin Electric PowerLtd has shed CN¥614m from its market cap this week, let's take a look at its longer term fundamental trends and see if they've driven returns.
Check out our latest analysis for Jilin Electric PowerLtd
To quote Buffett, 'Ships will sail around the world but the Flat Earth Society will flourish. There will continue to be wide discrepancies between price and value in the marketplace...' One flawed but reasonable way to assess how sentiment around a company has changed is to compare the earnings per share (EPS) with the share price.
During five years of share price growth, Jilin Electric PowerLtd achieved compound earnings per share (EPS) growth of 37% per year. This EPS growth is higher than the 10% average annual increase in the share price. So it seems the market isn't so enthusiastic about the stock these days. The reasonably low P/E ratio of 11.68 also suggests market apprehension.
The image below shows how EPS has tracked over time (if you click on the image you can see greater detail).
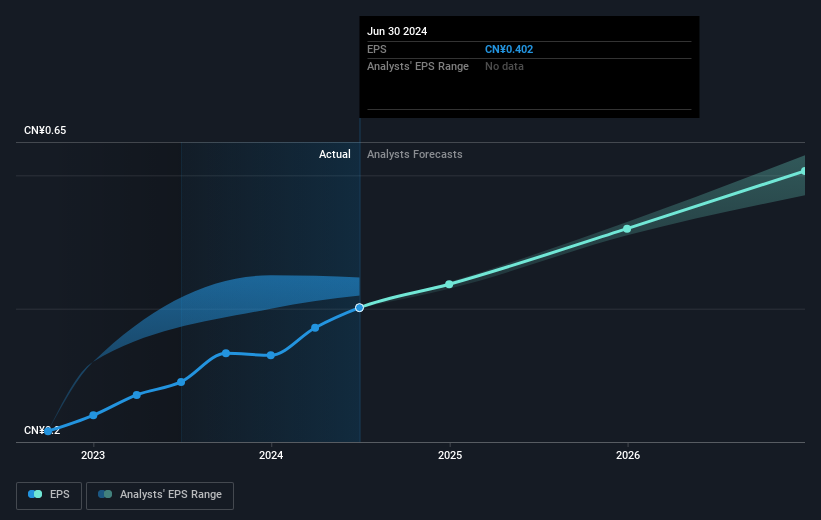
We know that Jilin Electric PowerLtd has improved its bottom line lately, but is it going to grow revenue? You could check out this free report showing analyst revenue forecasts.
What About Dividends?
When looking at investment returns, it is important to consider the difference between total shareholder return (TSR) and share price return. The TSR incorporates the value of any spin-offs or discounted capital raisings, along with any dividends, based on the assumption that the dividends are reinvested. Arguably, the TSR gives a more comprehensive picture of the return generated by a stock. We note that for Jilin Electric PowerLtd the TSR over the last 5 years was 69%, which is better than the share price return mentioned above. And there's no prize for guessing that the dividend payments largely explain the divergence!
A Different Perspective
While it's never nice to take a loss, Jilin Electric PowerLtd shareholders can take comfort that , including dividends,their trailing twelve month loss of 0.5% wasn't as bad as the market loss of around 16%. Longer term investors wouldn't be so upset, since they would have made 11%, each year, over five years. In the best case scenario the last year is just a temporary blip on the journey to a brighter future. While it is well worth considering the different impacts that market conditions can have on the share price, there are other factors that are even more important. Take risks, for example - Jilin Electric PowerLtd has 2 warning signs (and 1 which makes us a bit uncomfortable) we think you should know about.
If you are like me, then you will not want to miss this free list of undervalued small caps that insiders are buying.
Please note, the market returns quoted in this article reflect the market weighted average returns of stocks that currently trade on Chinese exchanges.
New: Manage All Your Stock Portfolios in One Place
We've created the ultimate portfolio companion for stock investors, and it's free.
• Connect an unlimited number of Portfolios and see your total in one currency
• Be alerted to new Warning Signs or Risks via email or mobile
• Track the Fair Value of your stocks
Have feedback on this article? Concerned about the content? Get in touch with us directly. Alternatively, email editorial-team (at) simplywallst.com.
This article by Simply Wall St is general in nature. We provide commentary based on historical data and analyst forecasts only using an unbiased methodology and our articles are not intended to be financial advice. It does not constitute a recommendation to buy or sell any stock, and does not take account of your objectives, or your financial situation. We aim to bring you long-term focused analysis driven by fundamental data. Note that our analysis may not factor in the latest price-sensitive company announcements or qualitative material. Simply Wall St has no position in any stocks mentioned.
About SZSE:000875
Jilin Electric PowerLtd
Engages in the power generation and heating business in China.
Solid track record and fair value.
