
Advertisement
- China
- /
- Other Utilities
- /
- SHSE:600719
More Unpleasant Surprises Could Be In Store For Dalian Thermal Power Co.,Ltd.'s (SHSE:600719) Shares After Tumbling 26%
Dalian Thermal Power Co.,Ltd. (SHSE:600719) shares have retraced a considerable 26% in the last month, reversing a fair amount of their solid recent performance. Longer-term shareholders would now have taken a real hit with the stock declining 6.1% in the last year.
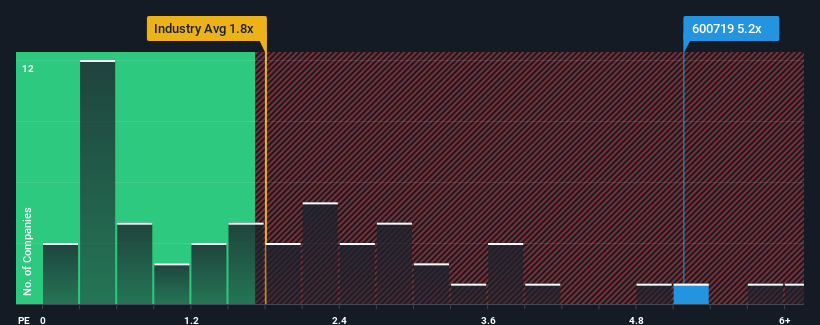
In spite of the heavy fall in price, you could still be forgiven for thinking Dalian Thermal PowerLtd is a stock to steer clear of with a price-to-sales ratios (or "P/S") of 5.2x, considering almost half the companies in China's Integrated Utilities industry have P/S ratios below 3x. Nonetheless, we'd need to dig a little deeper to determine if there is a rational basis for the highly elevated P/S.
Check out our latest analysis for Dalian Thermal PowerLtd
What Does Dalian Thermal PowerLtd's Recent Performance Look Like?
For instance, Dalian Thermal PowerLtd's receding revenue in recent times would have to be some food for thought. One possibility is that the P/S is high because investors think the company will still do enough to outperform the broader industry in the near future. You'd really hope so, otherwise you're paying a pretty hefty price for no particular reason.
Although there are no analyst estimates available for Dalian Thermal PowerLtd, take a look at this free data-rich visualisation to see how the company stacks up on earnings, revenue and cash flow.Is There Enough Revenue Growth Forecasted For Dalian Thermal PowerLtd?
There's an inherent assumption that a company should far outperform the industry for P/S ratios like Dalian Thermal PowerLtd's to be considered reasonable.
Retrospectively, the last year delivered a frustrating 18% decrease to the company's top line. As a result, revenue from three years ago have also fallen 3.7% overall. So unfortunately, we have to acknowledge that the company has not done a great job of growing revenue over that time.
Comparing that to the industry, which is predicted to deliver 8.2% growth in the next 12 months, the company's downward momentum based on recent medium-term revenue results is a sobering picture.
With this in mind, we find it worrying that Dalian Thermal PowerLtd's P/S exceeds that of its industry peers. Apparently many investors in the company are way more bullish than recent times would indicate and aren't willing to let go of their stock at any price. Only the boldest would assume these prices are sustainable as a continuation of recent revenue trends is likely to weigh heavily on the share price eventually.
What We Can Learn From Dalian Thermal PowerLtd's P/S?
Even after such a strong price drop, Dalian Thermal PowerLtd's P/S still exceeds the industry median significantly. Typically, we'd caution against reading too much into price-to-sales ratios when settling on investment decisions, though it can reveal plenty about what other market participants think about the company.
Our examination of Dalian Thermal PowerLtd revealed its shrinking revenue over the medium-term isn't resulting in a P/S as low as we expected, given the industry is set to grow. Right now we aren't comfortable with the high P/S as this revenue performance is highly unlikely to support such positive sentiment for long. If recent medium-term revenue trends continue, it will place shareholders' investments at significant risk and potential investors in danger of paying an excessive premium.
Before you settle on your opinion, we've discovered 3 warning signs for Dalian Thermal PowerLtd that you should be aware of.
If companies with solid past earnings growth is up your alley, you may wish to see this free collection of other companies with strong earnings growth and low P/E ratios.
New: Manage All Your Stock Portfolios in One Place
We've created the ultimate portfolio companion for stock investors, and it's free.
• Connect an unlimited number of Portfolios and see your total in one currency
• Be alerted to new Warning Signs or Risks via email or mobile
• Track the Fair Value of your stocks
Have feedback on this article? Concerned about the content? Get in touch with us directly. Alternatively, email editorial-team (at) simplywallst.com.
This article by Simply Wall St is general in nature. We provide commentary based on historical data and analyst forecasts only using an unbiased methodology and our articles are not intended to be financial advice. It does not constitute a recommendation to buy or sell any stock, and does not take account of your objectives, or your financial situation. We aim to bring you long-term focused analysis driven by fundamental data. Note that our analysis may not factor in the latest price-sensitive company announcements or qualitative material. Simply Wall St has no position in any stocks mentioned.
Have feedback on this article? Concerned about the content? Get in touch with us directly. Alternatively, email editorial-team@simplywallst.com
About SHSE:600719
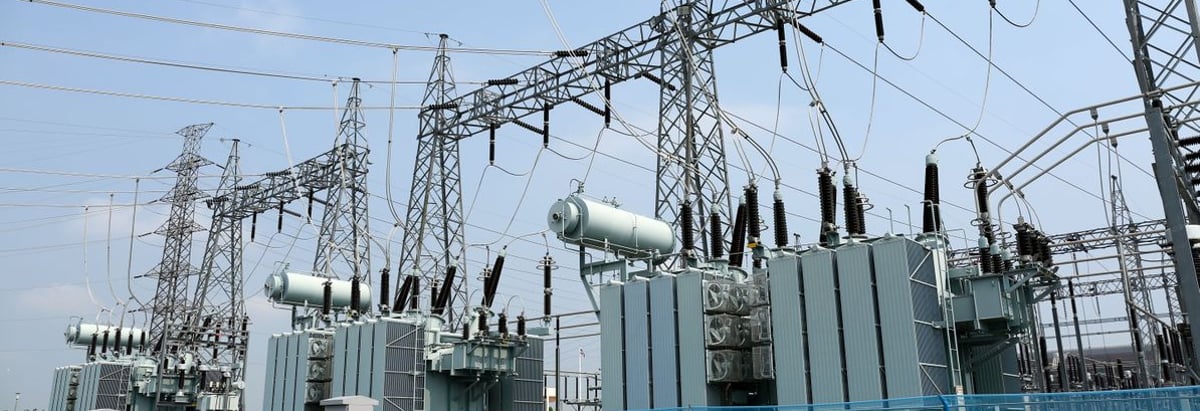
Dalian Thermal PowerLtd
Engages in the cogeneration and central heating business in China.
Very low with weak fundamentals.
Market Insights

Advertisement
Community Narratives
The Future of Drug Testing? Fingerprint Tech Shows Serious Promise
Fair Value US$2.98|43.0% undervalued
JO
Community Contributor
Occidental Petroleum is set to achieve a 16% profit margin improvement
Fair Value US$55.05|21.5% undervalued
DZ
Community Contributor
Argan's Revenue Set to Soar with a 13.31% Growth in the Coming Decade
Fair Value US$284.68|23.4% undervalued
KE
Community Contributor
EU#1 - From German Startup to EU’s Biggest Company
Fair Value €248.62|7.6% overvalued
TO
Community Contributor