
Advertisement
- China
- /
- Electric Utilities
- /
- SHSE:600505
After Leaping 29% Sichuan Xichang Electric Power Co.,Ltd. (SHSE:600505) Shares Are Not Flying Under The Radar
Those holding Sichuan Xichang Electric Power Co.,Ltd. (SHSE:600505) shares would be relieved that the share price has rebounded 29% in the last thirty days, but it needs to keep going to repair the recent damage it has caused to investor portfolios. Not all shareholders will be feeling jubilant, since the share price is still down a very disappointing 13% in the last twelve months.
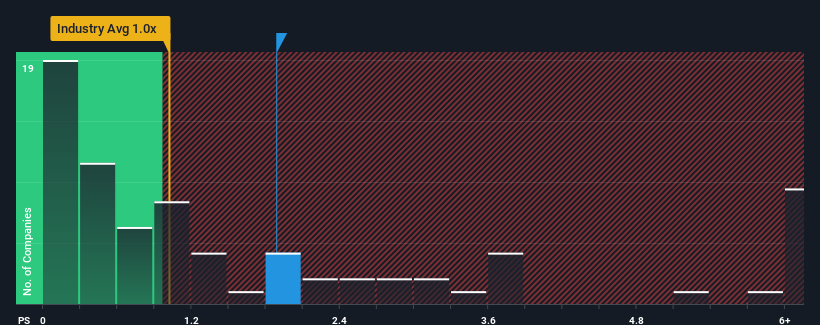
Since its price has surged higher, given close to half the companies operating in China's Electric Utilities industry have price-to-sales ratios (or "P/S") below 1.3x, you may consider Sichuan Xichang Electric PowerLtd as a stock to potentially avoid with its 1.9x P/S ratio. Nonetheless, we'd need to dig a little deeper to determine if there is a rational basis for the elevated P/S.
Check out our latest analysis for Sichuan Xichang Electric PowerLtd
What Does Sichuan Xichang Electric PowerLtd's P/S Mean For Shareholders?
Sichuan Xichang Electric PowerLtd has been doing a good job lately as it's been growing revenue at a solid pace. One possibility is that the P/S ratio is high because investors think this respectable revenue growth will be enough to outperform the broader industry in the near future. However, if this isn't the case, investors might get caught out paying too much for the stock.
We don't have analyst forecasts, but you can see how recent trends are setting up the company for the future by checking out our free report on Sichuan Xichang Electric PowerLtd's earnings, revenue and cash flow.What Are Revenue Growth Metrics Telling Us About The High P/S?
In order to justify its P/S ratio, Sichuan Xichang Electric PowerLtd would need to produce impressive growth in excess of the industry.
Retrospectively, the last year delivered an exceptional 26% gain to the company's top line. Pleasingly, revenue has also lifted 50% in aggregate from three years ago, thanks to the last 12 months of growth. So we can start by confirming that the company has done a great job of growing revenue over that time.
Comparing that recent medium-term revenue trajectory with the industry's one-year growth forecast of 10% shows it's noticeably more attractive.
With this in consideration, it's not hard to understand why Sichuan Xichang Electric PowerLtd's P/S is high relative to its industry peers. Presumably shareholders aren't keen to offload something they believe will continue to outmanoeuvre the wider industry.
The Bottom Line On Sichuan Xichang Electric PowerLtd's P/S
The large bounce in Sichuan Xichang Electric PowerLtd's shares has lifted the company's P/S handsomely. Generally, our preference is to limit the use of the price-to-sales ratio to establishing what the market thinks about the overall health of a company.
We've established that Sichuan Xichang Electric PowerLtd maintains its high P/S on the strength of its recent three-year growth being higher than the wider industry forecast, as expected. Right now shareholders are comfortable with the P/S as they are quite confident revenue aren't under threat. Barring any significant changes to the company's ability to make money, the share price should continue to be propped up.
You should always think about risks. Case in point, we've spotted 2 warning signs for Sichuan Xichang Electric PowerLtd you should be aware of.
Of course, profitable companies with a history of great earnings growth are generally safer bets. So you may wish to see this free collection of other companies that have reasonable P/E ratios and have grown earnings strongly.
New: Manage All Your Stock Portfolios in One Place
We've created the ultimate portfolio companion for stock investors, and it's free.
• Connect an unlimited number of Portfolios and see your total in one currency
• Be alerted to new Warning Signs or Risks via email or mobile
• Track the Fair Value of your stocks
Have feedback on this article? Concerned about the content? Get in touch with us directly. Alternatively, email editorial-team (at) simplywallst.com.
This article by Simply Wall St is general in nature. We provide commentary based on historical data and analyst forecasts only using an unbiased methodology and our articles are not intended to be financial advice. It does not constitute a recommendation to buy or sell any stock, and does not take account of your objectives, or your financial situation. We aim to bring you long-term focused analysis driven by fundamental data. Note that our analysis may not factor in the latest price-sensitive company announcements or qualitative material. Simply Wall St has no position in any stocks mentioned.
About SHSE:600505
Sichuan Xichang Electric PowerLtd
Engages in generation, supply, distribution, and sale of hydropower power in Liangshan prefecture, Sichuan province, China.
Low risk and overvalued.
Market Insights

Advertisement
Community Narratives
The company that turned a verb into a global necessity and basically runs the modern internet, digital ads, smartphones, maps, and AI.
Fair Value US$300.00|5.4% undervalued
OS
Community Contributor
Flowers Foods Pays A Fair Price For Health
Fair Value US$16.12|26.3% undervalued
NV
Community Contributor
TMX Group will thrive with 33.3% profit margin and enduring market moat
Fair Value CA$49.90|4.1% overvalued
LI
Community Contributor
The "Molecular Pencil": Why Beam's Technology is Built to Win
Fair Value US$65.01|62.7% undervalued
DA
Community Contributor