
Advertisement
- China
- /
- Electronic Equipment and Components
- /
- SZSE:301486
Optimistic Investors Push Shenzhen Zesum Technology Co.,Ltd (SZSE:301486) Shares Up 61% But Growth Is Lacking
Shenzhen Zesum Technology Co.,Ltd (SZSE:301486) shareholders would be excited to see that the share price has had a great month, posting a 61% gain and recovering from prior weakness. Longer-term shareholders would be thankful for the recovery in the share price since it's now virtually flat for the year after the recent bounce.
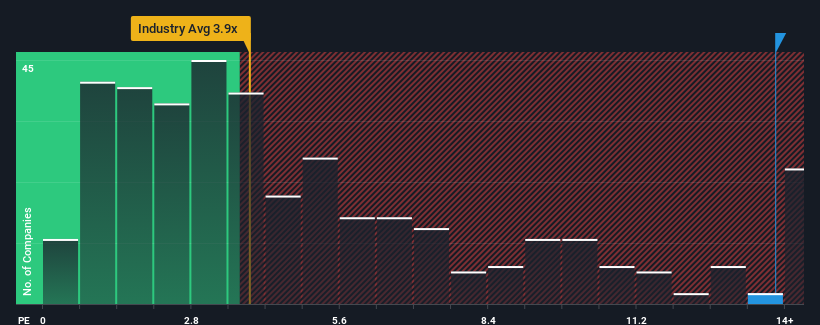
After such a large jump in price, you could be forgiven for thinking Shenzhen Zesum TechnologyLtd is a stock to steer clear of with a price-to-sales ratios (or "P/S") of 13.8x, considering almost half the companies in China's Electronic industry have P/S ratios below 3.9x. However, the P/S might be quite high for a reason and it requires further investigation to determine if it's justified.
Check out our latest analysis for Shenzhen Zesum TechnologyLtd
How Shenzhen Zesum TechnologyLtd Has Been Performing
For example, consider that Shenzhen Zesum TechnologyLtd's financial performance has been poor lately as its revenue has been in decline. It might be that many expect the company to still outplay most other companies over the coming period, which has kept the P/S from collapsing. If not, then existing shareholders may be quite nervous about the viability of the share price.
Want the full picture on earnings, revenue and cash flow for the company? Then our free report on Shenzhen Zesum TechnologyLtd will help you shine a light on its historical performance.How Is Shenzhen Zesum TechnologyLtd's Revenue Growth Trending?
In order to justify its P/S ratio, Shenzhen Zesum TechnologyLtd would need to produce outstanding growth that's well in excess of the industry.
Retrospectively, the last year delivered a frustrating 11% decrease to the company's top line. Unfortunately, that's brought it right back to where it started three years ago with revenue growth being virtually non-existent overall during that time. So it appears to us that the company has had a mixed result in terms of growing revenue over that time.
Comparing the recent medium-term revenue trends against the industry's one-year growth forecast of 24% shows it's noticeably less attractive.
In light of this, it's alarming that Shenzhen Zesum TechnologyLtd's P/S sits above the majority of other companies. Apparently many investors in the company are way more bullish than recent times would indicate and aren't willing to let go of their stock at any price. There's a good chance existing shareholders are setting themselves up for future disappointment if the P/S falls to levels more in line with recent growth rates.
The Final Word
Shares in Shenzhen Zesum TechnologyLtd have seen a strong upwards swing lately, which has really helped boost its P/S figure. Typically, we'd caution against reading too much into price-to-sales ratios when settling on investment decisions, though it can reveal plenty about what other market participants think about the company.
Our examination of Shenzhen Zesum TechnologyLtd revealed its poor three-year revenue trends aren't detracting from the P/S as much as we though, given they look worse than current industry expectations. When we see slower than industry revenue growth but an elevated P/S, there's considerable risk of the share price declining, sending the P/S lower. If recent medium-term revenue trends continue, it will place shareholders' investments at significant risk and potential investors in danger of paying an excessive premium.
We don't want to rain on the parade too much, but we did also find 1 warning sign for Shenzhen Zesum TechnologyLtd that you need to be mindful of.
It's important to make sure you look for a great company, not just the first idea you come across. So if growing profitability aligns with your idea of a great company, take a peek at this free list of interesting companies with strong recent earnings growth (and a low P/E).
New: Manage All Your Stock Portfolios in One Place
We've created the ultimate portfolio companion for stock investors, and it's free.
• Connect an unlimited number of Portfolios and see your total in one currency
• Be alerted to new Warning Signs or Risks via email or mobile
• Track the Fair Value of your stocks
Have feedback on this article? Concerned about the content? Get in touch with us directly. Alternatively, email editorial-team (at) simplywallst.com.
This article by Simply Wall St is general in nature. We provide commentary based on historical data and analyst forecasts only using an unbiased methodology and our articles are not intended to be financial advice. It does not constitute a recommendation to buy or sell any stock, and does not take account of your objectives, or your financial situation. We aim to bring you long-term focused analysis driven by fundamental data. Note that our analysis may not factor in the latest price-sensitive company announcements or qualitative material. Simply Wall St has no position in any stocks mentioned.
About SZSE:301486
Shenzhen Zesum Technology
Engages in the research, design, development, manufacturing, and sale of precision electronic components in China and internationally.
Solid track record with excellent balance sheet.
Market Insights

Advertisement
Community Narratives
MicroVision will explode future revenue by 380.37% with a vision towards success
Fair Value US$60|98.4% undervalued
TH
Community Contributor
The Indispensable Artery for a New North American Economy
Fair Value CA$132.87|1.6% undervalued
TI
Community Contributor
Recently Updated Narratives
BE


Bejgal on MINISO Group Holding ·
MINISO's fair value is projected at 26.69 with an anticipated PE ratio shift of 20x
Fair Value:US$26.6928.0% undervalued
44 followersusers have followed this narrative
3 commentsusers have commented on this narrative
0 likesusers have liked this narrative
TI


TickerTickle on Oracle ·
The Quiet Giant That Became AI’s Power Grid
Fair Value:US$389.8149.5% undervalued
7 followersusers have followed this narrative
1 commentusers have commented on this narrative
0 likesusers have liked this narrative
AU

AuCA on Nova Ljubljanska Banka d.d ·
Nova Ljubljanska Banka d.d will expect a 11.2% revenue boost driving future growth
Fair Value:€20916.5% undervalued
23 followersusers have followed this narrative
3 commentsusers have commented on this narrative
0 likesusers have liked this narrative
Popular Narratives
OS


oscargarcia on Alphabet ·
The company that turned a verb into a global necessity and basically runs the modern internet, digital ads, smartphones, maps, and AI.
Fair Value:US$3404.9% undervalued
136 followersusers have followed this narrative
6 commentsusers have commented on this narrative
18 likesusers have liked this narrative
TH

TheWallstreetKing on MicroVision ·
MicroVision will explode future revenue by 380.37% with a vision towards success
Fair Value:US$6098.4% undervalued
87 followersusers have followed this narrative
11 commentsusers have commented on this narrative
18 likesusers have liked this narrative
AN


AnalystConsensusTarget on NVIDIA ·
NVDA: Expanding AI Demand Will Drive Major Data Center Investments Through 2026
Fair Value:US$232.7923.6% undervalued
925 followersusers have followed this narrative
6 commentsusers have commented on this narrative
22 likesusers have liked this narrative