
Advertisement
- China
- /
- Electronic Equipment and Components
- /
- SZSE:301150
Investors Still Aren't Entirely Convinced By Hubei Zhongyi Technology Inc.'s (SZSE:301150) Revenues Despite 26% Price Jump
Hubei Zhongyi Technology Inc. (SZSE:301150) shares have had a really impressive month, gaining 26% after a shaky period beforehand. Unfortunately, the gains of the last month did little to right the losses of the last year with the stock still down 19% over that time.
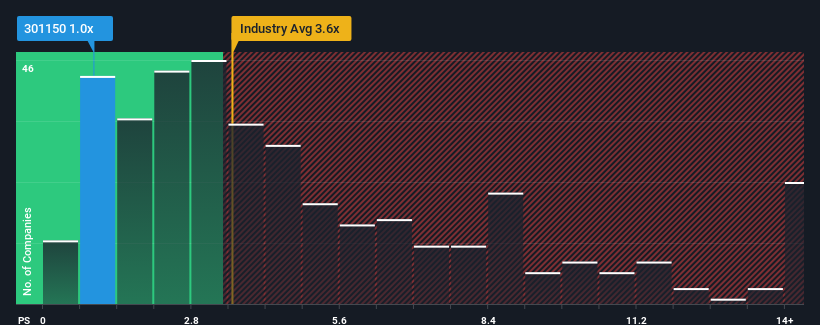
Although its price has surged higher, Hubei Zhongyi Technology may still look like a strong buying opportunity at present with its price-to-sales (or "P/S") ratio of 1x, considering almost half of all companies in the Electronic industry in China have P/S ratios greater than 3.6x and even P/S higher than 7x aren't out of the ordinary. Nonetheless, we'd need to dig a little deeper to determine if there is a rational basis for the highly reduced P/S.
View our latest analysis for Hubei Zhongyi Technology
What Does Hubei Zhongyi Technology's Recent Performance Look Like?
Recent times have been quite advantageous for Hubei Zhongyi Technology as its revenue has been rising very briskly. Perhaps the market is expecting future revenue performance to dwindle, which has kept the P/S suppressed. If that doesn't eventuate, then existing shareholders have reason to be quite optimistic about the future direction of the share price.
Want the full picture on earnings, revenue and cash flow for the company? Then our free report on Hubei Zhongyi Technology will help you shine a light on its historical performance.What Are Revenue Growth Metrics Telling Us About The Low P/S?
Hubei Zhongyi Technology's P/S ratio would be typical for a company that's expected to deliver very poor growth or even falling revenue, and importantly, perform much worse than the industry.
If we review the last year of revenue growth, the company posted a terrific increase of 34%. The strong recent performance means it was also able to grow revenue by 142% in total over the last three years. Therefore, it's fair to say the revenue growth recently has been superb for the company.
When compared to the industry's one-year growth forecast of 26%, the most recent medium-term revenue trajectory is noticeably more alluring
In light of this, it's peculiar that Hubei Zhongyi Technology's P/S sits below the majority of other companies. Apparently some shareholders believe the recent performance has exceeded its limits and have been accepting significantly lower selling prices.
What Does Hubei Zhongyi Technology's P/S Mean For Investors?
Shares in Hubei Zhongyi Technology have risen appreciably however, its P/S is still subdued. Typically, we'd caution against reading too much into price-to-sales ratios when settling on investment decisions, though it can reveal plenty about what other market participants think about the company.
Our examination of Hubei Zhongyi Technology revealed its three-year revenue trends aren't boosting its P/S anywhere near as much as we would have predicted, given they look better than current industry expectations. When we see robust revenue growth that outpaces the industry, we presume that there are notable underlying risks to the company's future performance, which is exerting downward pressure on the P/S ratio. While recent revenue trends over the past medium-term suggest that the risk of a price decline is low, investors appear to perceive a likelihood of revenue fluctuations in the future.
You need to take note of risks, for example - Hubei Zhongyi Technology has 2 warning signs (and 1 which is significant) we think you should know about.
If strong companies turning a profit tickle your fancy, then you'll want to check out this free list of interesting companies that trade on a low P/E (but have proven they can grow earnings).
Valuation is complex, but we're here to simplify it.
Discover if Hubei Zhongyi Technology might be undervalued or overvalued with our detailed analysis, featuring fair value estimates, potential risks, dividends, insider trades, and its financial condition.
Access Free AnalysisHave feedback on this article? Concerned about the content? Get in touch with us directly. Alternatively, email editorial-team (at) simplywallst.com.
This article by Simply Wall St is general in nature. We provide commentary based on historical data and analyst forecasts only using an unbiased methodology and our articles are not intended to be financial advice. It does not constitute a recommendation to buy or sell any stock, and does not take account of your objectives, or your financial situation. We aim to bring you long-term focused analysis driven by fundamental data. Note that our analysis may not factor in the latest price-sensitive company announcements or qualitative material. Simply Wall St has no position in any stocks mentioned.
About SZSE:301150
Hubei Zhongyi Technology
Engages in research, development, production, and sale of electronic materials.
Excellent balance sheet and good value.
Market Insights

Advertisement
Community Narratives
MicroVision will explode future revenue by 380.37% with a vision towards success
Fair Value US$60.00|98.5% undervalued
TH
Community Contributor
The Indispensable Artery for a New North American Economy
Fair Value CA$132.87|2.3% undervalued
TI
Community Contributor