- China
- /
- Electronic Equipment and Components
- /
- SZSE:300909
Shenzhen Hui Chuang Da Technology Co., Ltd. (SZSE:300909) Stock Rockets 28% As Investors Are Less Pessimistic Than Expected
Those holding Shenzhen Hui Chuang Da Technology Co., Ltd. (SZSE:300909) shares would be relieved that the share price has rebounded 28% in the last thirty days, but it needs to keep going to repair the recent damage it has caused to investor portfolios. Not all shareholders will be feeling jubilant, since the share price is still down a very disappointing 34% in the last twelve months.
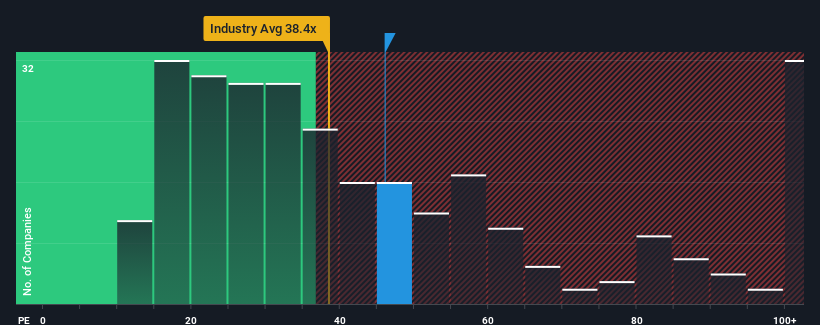
After such a large jump in price, given close to half the companies in China have price-to-earnings ratios (or "P/E's") below 30x, you may consider Shenzhen Hui Chuang Da Technology as a stock to avoid entirely with its 46.1x P/E ratio. Although, it's not wise to just take the P/E at face value as there may be an explanation why it's so lofty.
For example, consider that Shenzhen Hui Chuang Da Technology's financial performance has been poor lately as its earnings have been in decline. It might be that many expect the company to still outplay most other companies over the coming period, which has kept the P/E from collapsing. You'd really hope so, otherwise you're paying a pretty hefty price for no particular reason.
See our latest analysis for Shenzhen Hui Chuang Da Technology

Does Growth Match The High P/E?
The only time you'd be truly comfortable seeing a P/E as steep as Shenzhen Hui Chuang Da Technology's is when the company's growth is on track to outshine the market decidedly.
If we review the last year of earnings, dishearteningly the company's profits fell to the tune of 43%. The last three years don't look nice either as the company has shrunk EPS by 48% in aggregate. Accordingly, shareholders would have felt downbeat about the medium-term rates of earnings growth.
Weighing that medium-term earnings trajectory against the broader market's one-year forecast for expansion of 41% shows it's an unpleasant look.
In light of this, it's alarming that Shenzhen Hui Chuang Da Technology's P/E sits above the majority of other companies. It seems most investors are ignoring the recent poor growth rate and are hoping for a turnaround in the company's business prospects. There's a very good chance existing shareholders are setting themselves up for future disappointment if the P/E falls to levels more in line with the recent negative growth rates.
The Bottom Line On Shenzhen Hui Chuang Da Technology's P/E
The strong share price surge has got Shenzhen Hui Chuang Da Technology's P/E rushing to great heights as well. It's argued the price-to-earnings ratio is an inferior measure of value within certain industries, but it can be a powerful business sentiment indicator.
Our examination of Shenzhen Hui Chuang Da Technology revealed its shrinking earnings over the medium-term aren't impacting its high P/E anywhere near as much as we would have predicted, given the market is set to grow. When we see earnings heading backwards and underperforming the market forecasts, we suspect the share price is at risk of declining, sending the high P/E lower. If recent medium-term earnings trends continue, it will place shareholders' investments at significant risk and potential investors in danger of paying an excessive premium.
It is also worth noting that we have found 3 warning signs for Shenzhen Hui Chuang Da Technology that you need to take into consideration.
If these risks are making you reconsider your opinion on Shenzhen Hui Chuang Da Technology, explore our interactive list of high quality stocks to get an idea of what else is out there.
New: Manage All Your Stock Portfolios in One Place
We've created the ultimate portfolio companion for stock investors, and it's free.
• Connect an unlimited number of Portfolios and see your total in one currency
• Be alerted to new Warning Signs or Risks via email or mobile
• Track the Fair Value of your stocks
Have feedback on this article? Concerned about the content? Get in touch with us directly. Alternatively, email editorial-team (at) simplywallst.com.
This article by Simply Wall St is general in nature. We provide commentary based on historical data and analyst forecasts only using an unbiased methodology and our articles are not intended to be financial advice. It does not constitute a recommendation to buy or sell any stock, and does not take account of your objectives, or your financial situation. We aim to bring you long-term focused analysis driven by fundamental data. Note that our analysis may not factor in the latest price-sensitive company announcements or qualitative material. Simply Wall St has no position in any stocks mentioned.
About SZSE:300909
Shenzhen Hui Chuang Da Technology
Shenzhen Hui Chuang Da Technology Co., Ltd.
Adequate balance sheet with low risk.
Market Insights
Community Narratives


Recently Updated Narratives


MINISO's fair value is projected at 26.69 with an anticipated PE ratio shift of 20x


The Quiet Giant That Became AI’s Power Grid


Nova Ljubljanska Banka d.d will expect a 11.2% revenue boost driving future growth
Popular Narratives


The company that turned a verb into a global necessity and basically runs the modern internet, digital ads, smartphones, maps, and AI.


MicroVision will explode future revenue by 380.37% with a vision towards success


