
Advertisement
- China
- /
- Electronic Equipment and Components
- /
- SZSE:300657
XiaMen HongXin Electron-tech Group Co.,Ltd (SZSE:300657) Surges 29% Yet Its Low P/S Is No Reason For Excitement
Those holding XiaMen HongXin Electron-tech Group Co.,Ltd (SZSE:300657) shares would be relieved that the share price has rebounded 29% in the last thirty days, but it needs to keep going to repair the recent damage it has caused to investor portfolios. Looking back a bit further, it's encouraging to see the stock is up 50% in the last year.
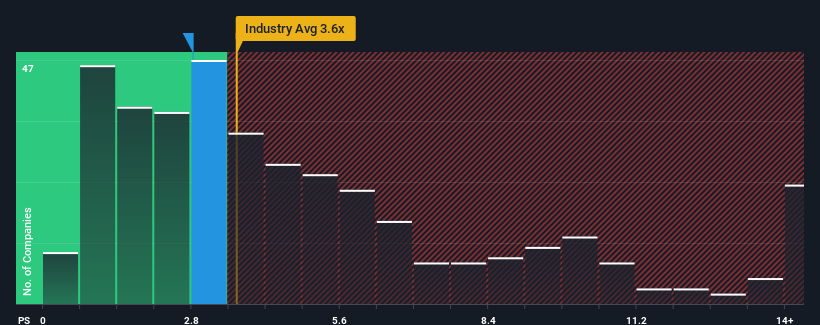
Although its price has surged higher, XiaMen HongXin Electron-tech GroupLtd may still be sending buy signals at present with its price-to-sales (or "P/S") ratio of 2.8x, considering almost half of all companies in the Electronic industry in China have P/S ratios greater than 3.6x and even P/S higher than 7x aren't out of the ordinary. Nonetheless, we'd need to dig a little deeper to determine if there is a rational basis for the reduced P/S.
See our latest analysis for XiaMen HongXin Electron-tech GroupLtd
What Does XiaMen HongXin Electron-tech GroupLtd's P/S Mean For Shareholders?
It looks like revenue growth has deserted XiaMen HongXin Electron-tech GroupLtd recently, which is not something to boast about. It might be that many expect the uninspiring revenue performance to worsen, which has repressed the P/S. If you like the company, you'd be hoping this isn't the case so that you could potentially pick up some stock while it's out of favour.
We don't have analyst forecasts, but you can see how recent trends are setting up the company for the future by checking out our free report on XiaMen HongXin Electron-tech GroupLtd's earnings, revenue and cash flow.What Are Revenue Growth Metrics Telling Us About The Low P/S?
There's an inherent assumption that a company should underperform the industry for P/S ratios like XiaMen HongXin Electron-tech GroupLtd's to be considered reasonable.
If we review the last year of revenue, the company posted a result that saw barely any deviation from a year ago. Regardless, revenue has managed to lift by a handy 26% in aggregate from three years ago, thanks to the earlier period of growth. Accordingly, shareholders probably wouldn't have been overly satisfied with the unstable medium-term growth rates.
Comparing that to the industry, which is predicted to deliver 26% growth in the next 12 months, the company's momentum is weaker, based on recent medium-term annualised revenue results.
With this in consideration, it's easy to understand why XiaMen HongXin Electron-tech GroupLtd's P/S falls short of the mark set by its industry peers. Apparently many shareholders weren't comfortable holding on to something they believe will continue to trail the wider industry.
What Does XiaMen HongXin Electron-tech GroupLtd's P/S Mean For Investors?
The latest share price surge wasn't enough to lift XiaMen HongXin Electron-tech GroupLtd's P/S close to the industry median. While the price-to-sales ratio shouldn't be the defining factor in whether you buy a stock or not, it's quite a capable barometer of revenue expectations.
In line with expectations, XiaMen HongXin Electron-tech GroupLtd maintains its low P/S on the weakness of its recent three-year growth being lower than the wider industry forecast. At this stage investors feel the potential for an improvement in revenue isn't great enough to justify a higher P/S ratio. Unless the recent medium-term conditions improve, they will continue to form a barrier for the share price around these levels.
And what about other risks? Every company has them, and we've spotted 1 warning sign for XiaMen HongXin Electron-tech GroupLtd you should know about.
If these risks are making you reconsider your opinion on XiaMen HongXin Electron-tech GroupLtd, explore our interactive list of high quality stocks to get an idea of what else is out there.
New: AI Stock Screener & Alerts
Our new AI Stock Screener scans the market every day to uncover opportunities.
• Dividend Powerhouses (3%+ Yield)
• Undervalued Small Caps with Insider Buying
• High growth Tech and AI Companies
Or build your own from over 50 metrics.
Have feedback on this article? Concerned about the content? Get in touch with us directly. Alternatively, email editorial-team (at) simplywallst.com.
This article by Simply Wall St is general in nature. We provide commentary based on historical data and analyst forecasts only using an unbiased methodology and our articles are not intended to be financial advice. It does not constitute a recommendation to buy or sell any stock, and does not take account of your objectives, or your financial situation. We aim to bring you long-term focused analysis driven by fundamental data. Note that our analysis may not factor in the latest price-sensitive company announcements or qualitative material. Simply Wall St has no position in any stocks mentioned.
About SZSE:300657
Xiamen Hongxin Electronics Technology Group
Xiamen Hongxin Electronics Technology Group Inc.
Exceptional growth potential with questionable track record.
Similar Companies
Market Insights

Advertisement
Community Narratives
The "Molecular Pencil": Why Beam's Technology is Built to Win
Fair Value US$65.01|65.4% undervalued
DA
Community Contributor
The silent giant behind virtually every advanced chip powering AI, smartphones, and modern infrastructure.
Fair Value US$310.00|6.1% undervalued
OS
Community Contributor
ADP Stock: Solid Fundamentals, But AI Investments Test Its Margin Resilience
Fair Value US$387.77|34.2% undervalued
YI
Community Contributor
MINISO's fair value is projected at 26.69 with an anticipated PE ratio shift of 20x
Fair Value US$24.03|9.6% undervalued
BE
Community Contributor