- China
- /
- Communications
- /
- SZSE:300638
Fibocom Wireless Inc.'s (SZSE:300638) market cap increased by CN¥1.1b, insiders receive a 40% cut


Key Insights
- Fibocom Wireless' significant insider ownership suggests inherent interests in company's expansion
- The top 5 shareholders own 51% of the company
- Institutions own 14% of Fibocom Wireless
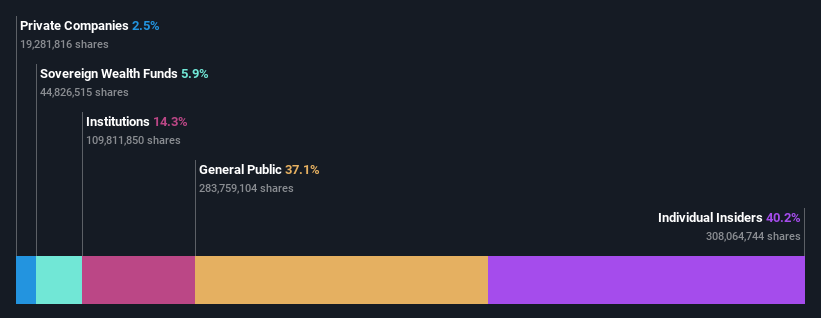
If you want to know who really controls Fibocom Wireless Inc. (SZSE:300638), then you'll have to look at the makeup of its share registry. With 40% stake, individual insiders possess the maximum shares in the company. Put another way, the group faces the maximum upside potential (or downside risk).
As a result, insiders were the biggest beneficiaries of last week’s 8.9% gain.
In the chart below, we zoom in on the different ownership groups of Fibocom Wireless.
See our latest analysis for Fibocom Wireless
What Does The Institutional Ownership Tell Us About Fibocom Wireless?
Institutions typically measure themselves against a benchmark when reporting to their own investors, so they often become more enthusiastic about a stock once it's included in a major index. We would expect most companies to have some institutions on the register, especially if they are growing.
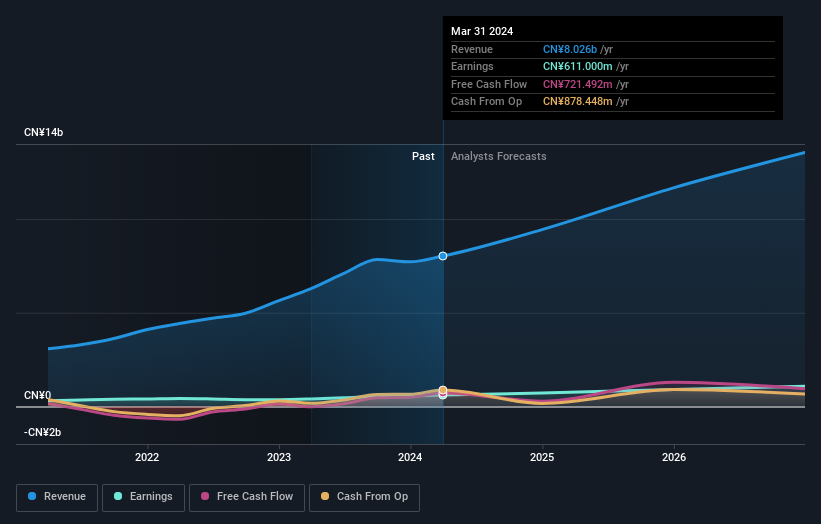
We can see that Fibocom Wireless does have institutional investors; and they hold a good portion of the company's stock. This can indicate that the company has a certain degree of credibility in the investment community. However, it is best to be wary of relying on the supposed validation that comes with institutional investors. They too, get it wrong sometimes. When multiple institutions own a stock, there's always a risk that they are in a 'crowded trade'. When such a trade goes wrong, multiple parties may compete to sell stock fast. This risk is higher in a company without a history of growth. You can see Fibocom Wireless' historic earnings and revenue below, but keep in mind there's always more to the story.
Hedge funds don't have many shares in Fibocom Wireless. Tian Yu Zhang is currently the largest shareholder, with 37% of shares outstanding. In comparison, the second and third largest shareholders hold about 5.9% and 3.3% of the stock.
Our research also brought to light the fact that roughly 51% of the company is controlled by the top 5 shareholders suggesting that these owners wield significant influence on the business.
Researching institutional ownership is a good way to gauge and filter a stock's expected performance. The same can be achieved by studying analyst sentiments. There are plenty of analysts covering the stock, so it might be worth seeing what they are forecasting, too.
Insider Ownership Of Fibocom Wireless
While the precise definition of an insider can be subjective, almost everyone considers board members to be insiders. Company management run the business, but the CEO will answer to the board, even if he or she is a member of it.
Insider ownership is positive when it signals leadership are thinking like the true owners of the company. However, high insider ownership can also give immense power to a small group within the company. This can be negative in some circumstances.
Our most recent data indicates that insiders own a reasonable proportion of Fibocom Wireless Inc.. Insiders own CN¥5.4b worth of shares in the CN¥13b company. That's quite meaningful. Most would say this shows a good degree of alignment with shareholders, especially in a company of this size. You can click here to see if those insiders have been buying or selling.
General Public Ownership
The general public, who are usually individual investors, hold a 37% stake in Fibocom Wireless. While this group can't necessarily call the shots, it can certainly have a real influence on how the company is run.
Next Steps:
I find it very interesting to look at who exactly owns a company. But to truly gain insight, we need to consider other information, too. For instance, we've identified 1 warning sign for Fibocom Wireless that you should be aware of.
If you would prefer discover what analysts are predicting in terms of future growth, do not miss this free report on analyst forecasts.
NB: Figures in this article are calculated using data from the last twelve months, which refer to the 12-month period ending on the last date of the month the financial statement is dated. This may not be consistent with full year annual report figures.
New: AI Stock Screener & Alerts
Our new AI Stock Screener scans the market every day to uncover opportunities.
• Dividend Powerhouses (3%+ Yield)
• Undervalued Small Caps with Insider Buying
• High growth Tech and AI Companies
Or build your own from over 50 metrics.
Have feedback on this article? Concerned about the content? Get in touch with us directly. Alternatively, email editorial-team (at) simplywallst.com.
This article by Simply Wall St is general in nature. We provide commentary based on historical data and analyst forecasts only using an unbiased methodology and our articles are not intended to be financial advice. It does not constitute a recommendation to buy or sell any stock, and does not take account of your objectives, or your financial situation. We aim to bring you long-term focused analysis driven by fundamental data. Note that our analysis may not factor in the latest price-sensitive company announcements or qualitative material. Simply Wall St has no position in any stocks mentioned.
Have feedback on this article? Concerned about the content? Get in touch with us directly. Alternatively, email editorial-team@simplywallst.com
About SZSE:300638
Fibocom Wireless
Provides wireless communication modules and solutions worldwide.
Solid track record with excellent balance sheet and pays a dividend.
