
Advertisement
- China
- /
- Electronic Equipment and Components
- /
- SZSE:300368
Hebei Huijin Group Co., Ltd. (SZSE:300368) Stock Rockets 34% As Investors Are Less Pessimistic Than Expected
Hebei Huijin Group Co., Ltd. (SZSE:300368) shares have continued their recent momentum with a 34% gain in the last month alone. But the last month did very little to improve the 52% share price decline over the last year.
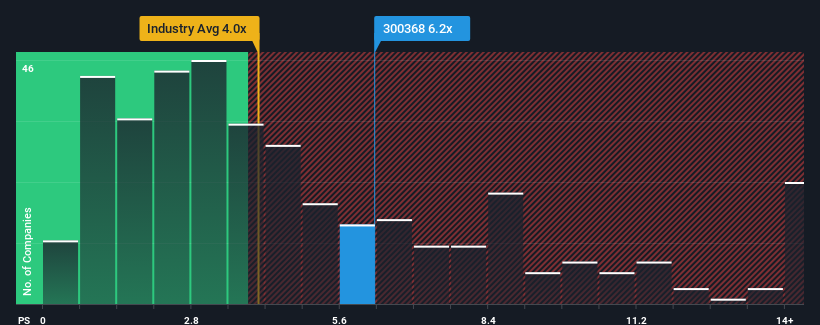
Following the firm bounce in price, Hebei Huijin Group's price-to-sales (or "P/S") ratio of 6.2x might make it look like a strong sell right now compared to other companies in the Electronic industry in China, where around half of the companies have P/S ratios below 4x and even P/S below 2x are quite common. Nonetheless, we'd need to dig a little deeper to determine if there is a rational basis for the highly elevated P/S.
View our latest analysis for Hebei Huijin Group
How Has Hebei Huijin Group Performed Recently?
As an illustration, revenue has deteriorated at Hebei Huijin Group over the last year, which is not ideal at all. One possibility is that the P/S is high because investors think the company will still do enough to outperform the broader industry in the near future. You'd really hope so, otherwise you're paying a pretty hefty price for no particular reason.
Although there are no analyst estimates available for Hebei Huijin Group, take a look at this free data-rich visualisation to see how the company stacks up on earnings, revenue and cash flow.What Are Revenue Growth Metrics Telling Us About The High P/S?
In order to justify its P/S ratio, Hebei Huijin Group would need to produce outstanding growth that's well in excess of the industry.
Retrospectively, the last year delivered a frustrating 19% decrease to the company's top line. This means it has also seen a slide in revenue over the longer-term as revenue is down 81% in total over the last three years. So unfortunately, we have to acknowledge that the company has not done a great job of growing revenue over that time.
Comparing that to the industry, which is predicted to deliver 26% growth in the next 12 months, the company's downward momentum based on recent medium-term revenue results is a sobering picture.
With this information, we find it concerning that Hebei Huijin Group is trading at a P/S higher than the industry. Apparently many investors in the company are way more bullish than recent times would indicate and aren't willing to let go of their stock at any price. Only the boldest would assume these prices are sustainable as a continuation of recent revenue trends is likely to weigh heavily on the share price eventually.
What We Can Learn From Hebei Huijin Group's P/S?
Hebei Huijin Group's P/S has grown nicely over the last month thanks to a handy boost in the share price. Typically, we'd caution against reading too much into price-to-sales ratios when settling on investment decisions, though it can reveal plenty about what other market participants think about the company.
We've established that Hebei Huijin Group currently trades on a much higher than expected P/S since its recent revenues have been in decline over the medium-term. Right now we aren't comfortable with the high P/S as this revenue performance is highly unlikely to support such positive sentiment for long. Should recent medium-term revenue trends persist, it would pose a significant risk to existing shareholders' investments and prospective investors will have a hard time accepting the current value of the stock.
Don't forget that there may be other risks. For instance, we've identified 2 warning signs for Hebei Huijin Group that you should be aware of.
It's important to make sure you look for a great company, not just the first idea you come across. So if growing profitability aligns with your idea of a great company, take a peek at this free list of interesting companies with strong recent earnings growth (and a low P/E).
Valuation is complex, but we're here to simplify it.
Discover if Hebei Huijin Group might be undervalued or overvalued with our detailed analysis, featuring fair value estimates, potential risks, dividends, insider trades, and its financial condition.
Access Free AnalysisHave feedback on this article? Concerned about the content? Get in touch with us directly. Alternatively, email editorial-team (at) simplywallst.com.
This article by Simply Wall St is general in nature. We provide commentary based on historical data and analyst forecasts only using an unbiased methodology and our articles are not intended to be financial advice. It does not constitute a recommendation to buy or sell any stock, and does not take account of your objectives, or your financial situation. We aim to bring you long-term focused analysis driven by fundamental data. Note that our analysis may not factor in the latest price-sensitive company announcements or qualitative material. Simply Wall St has no position in any stocks mentioned.
About SZSE:300368
Hebei Huijin Group
Engages in the manufacturing, information system integration, information data center, and supply chain business in China and internationally.
Flawless balance sheet with very low risk.
Market Insights

Advertisement
Community Narratives
MicroVision will explode future revenue by 380.37% with a vision towards success
Fair Value US$60|98.4% undervalued
TH
Community Contributor
The Indispensable Artery for a New North American Economy
Fair Value CA$132.87|0.6% undervalued
TI
Community Contributor
Recently Updated Narratives
BE


Bejgal on MINISO Group Holding ·
MINISO's fair value is projected at 26.69 with an anticipated PE ratio shift of 20x
Fair Value:US$26.6926.7% undervalued
44 followersusers have followed this narrative
3 commentsusers have commented on this narrative
0 likesusers have liked this narrative
TI


TickerTickle on Oracle ·
The Quiet Giant That Became AI’s Power Grid
Fair Value:US$389.8147.4% undervalued
8 followersusers have followed this narrative
1 commentusers have commented on this narrative
0 likesusers have liked this narrative
AU

AuCA on Nova Ljubljanska Banka d.d ·
Nova Ljubljanska Banka d.d will expect a 11.2% revenue boost driving future growth
Fair Value:€20916.5% undervalued
23 followersusers have followed this narrative
3 commentsusers have commented on this narrative
0 likesusers have liked this narrative
Popular Narratives
OS


oscargarcia on Alphabet ·
The company that turned a verb into a global necessity and basically runs the modern internet, digital ads, smartphones, maps, and AI.
Fair Value:US$3405.9% undervalued
136 followersusers have followed this narrative
6 commentsusers have commented on this narrative
18 likesusers have liked this narrative
TH

TheWallstreetKing on MicroVision ·
MicroVision will explode future revenue by 380.37% with a vision towards success
Fair Value:US$6098.4% undervalued
89 followersusers have followed this narrative
11 commentsusers have commented on this narrative
18 likesusers have liked this narrative
AN


AnalystConsensusTarget on NVIDIA ·
NVDA: Expanding AI Demand Will Drive Major Data Center Investments Through 2026
Fair Value:US$232.7922.6% undervalued
926 followersusers have followed this narrative
6 commentsusers have commented on this narrative
22 likesusers have liked this narrative